Download
1 / 41
420 likes | 645 Vues
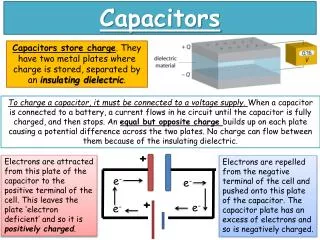
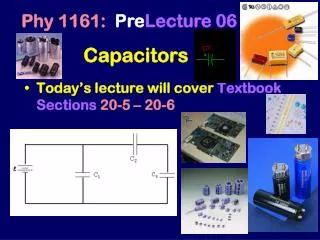
Capacitors. BITX20 bidirectional SSB transceiver. A BITX20 single stage. A simplified single stage. A simplified single stage with capacitors. C4. C3. C2. C1. Illustrated applications of capacitors. Power supply decoupling : See capacitor C1 Signal decoupling : See capacitor C2

E N D
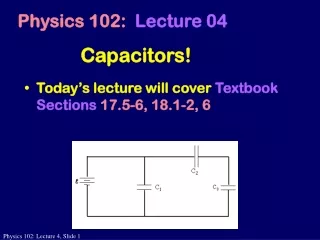
A simplified single stage with capacitors C4 C3 C2 C1
Illustrated applications of capacitors • Power supply decoupling: See capacitor C1 • Signal decoupling: See capacitor C2 • Signal coupling: See capacitors C3 and C4
Some other applicationsof capacitors • RC Filters: See later • Tuned circuits: In another talk (We need to discuss inductors first)
Fields • Electric fields • Capacitors • Magnetic Fields • Inductors • Electromagnetic (EM) fields • Radio waves • Antennas • Cables
Graph of capacitor discharge from 10VR=1 Ohm, C=1 Farad (or R=1 M Ohm, C=1 uF)
The same discharge from 27.18V e=2.718 10*2.718 10 10/2.718
Exponential decay The RC decay time constant = R times C If R is in Ohms and C in farads the time is in seconds Every time constant the voltage decays by the ratio of 2.718 This keeps on happening (till its lost in the noise) This ratio 2.718is called “e”.
Exponential decay It’s a smooth curve. We can work out the voltage at any moment. The voltage at any time t is: V = V0 / e(t/RC) V0 is the voltage at time zero. t/RC is the fractional number of decay time constants For e( ) you can use the ex key on your calculator
What can we say about the phase? The voltage across a resistor is always in phase with the current through it The voltage across a capacitor lags the current through it by 90 degrees So in an RC series circuit the phases of the R and C voltages are 90 degrees different.
What can we say about the amplitude? The higher the frequency the more current is needed to charge and discharge a capacitor to the same voltage. (Ignoring phase) we could say it has less resistance the higher the frequency. This is what we call impedance. The impedance of a capacitor in Ohms is 1/(2Pi*f*C) Where f is the frequency in Hertz and C the capacitance in Farads. (2Pi*f is also known as the frequency in radians per second w)
Vector diagram for the low pass Filter Leading Lagging So Vout lags (Vin-Vout) by 90 degrees. So we can calculate the filter output using Pythagoras As the frequency increases Vout moves round the circle from the top to the bottom on the right
Vector diagram for the low pass Filter Leading Lagging This diagram shows the corner frequency of the filter. This is the 3dB down point and the phase lag is 45 degrees This happens when the impedance of R and C are the same. R = 1/(2Pi*f*C).
Vector diagram for the high pass Filter Leading Lagging So Vout leads (Vin-Vout) by 90 degrees. So we can calculate the filter output using Pythagoras As the frequency increases Vout moves round the circle from the bottom to the topon the left
Our simplified single stage with capacitors C4 C3 C2 C1