Download
1 / 14
140 likes | 273 Vues
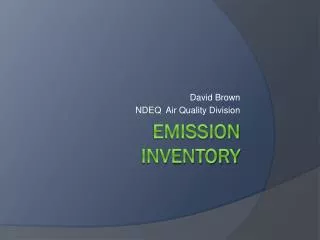
MOBILE SOURCE EMISSION INVENTORY FOR THE CITY OF CAPE TOWN. DAPPS Report-back Meeting Juliet Mert & Eugene Cairncross Peninsula Technikon 27 November 2003. OVERVIEW. DAPPS requirements Methodology (Toolkit and Manual method) Results Discussions/Conclusion Acknowledgements.

E N D
MOBILE SOURCE EMISSION INVENTORY FOR THE CITY OF CAPE TOWN DAPPS Report-back Meeting Juliet Mert & Eugene Cairncross Peninsula Technikon 27 November 2003
OVERVIEW • DAPPS requirements • Methodology (Toolkit and Manual method) • Results • Discussions/Conclusion • Acknowledgements
DAPPS Requirements • For mobile source emissions, DAPPS requires strip source emission rates of CO, HC, NOx, PM & SOx [g pollutant/s per strip]. • The IPIECA Toolkit predicts total mobile source emissions in the CMA(i.e. a mobile source emission inventory). • A spreadsheet was setup in an attempt to determine temporal and spatial emissions.
Methodology TOOLKIT METHOD • The IPIECA Toolkit is an emission inventory model, developed by IPIECA (UAQM) • The model estimates emission rates based on: vehicle kms traveled, fuel consumption rates, annual human and vehicle population growth rates.
Toolkit Results Total Petrol and Diesel Consumption, Modeled vs Actual
Methodology MANUAL METHOD • Basis: vehicle counts (for the CBD), ave. speeds, emission factors (EF) and route distances. • Vehicle counts obtained from the Annual Vehicle Screenline Survey for Cape Town CBD (2001). Counts were done at 11 points in the City centre. • Route distances were physically measured then sectioned into zones.
Study area boundary Counting stations boundary
Manual Results aEmission = zone distance*vehicles/hour*EF [g/h] b60% of vehicles accounted for in CMA
Discussion/Conclusion • There is a good match between Toolkit total fuel consumption and fuel sales figures. • The accuracy of estimated total and strip source emissions relies on valid assumptions, area boundaries and quality of data (such as vehicle counts).
Acknowledgements • CSIR • Pentech • SKR • SAWB • Naamsa, Sapia, Sapref, City of Cape Town *DAPPS is funded by the DACST’s Innovation Fund, administered by the NRF.