Download
1 / 30
320 likes | 476 Vues
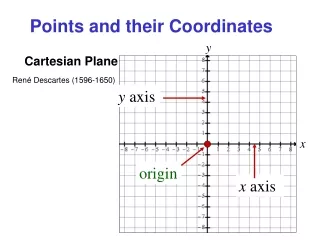
Cartesian Plane and Linear Equations in Two Variables. Math 021. The Cartesian Plane (coordinate grid) is a graph used to show a relationship between two variables. The horizontal axis is called the x-axis. The vertical axis is called the y-axis.

E N D
Cartesian Plane and Linear Equations in Two Variables Math 021
The Cartesian Plane (coordinate grid) is a graph used to show a relationship between two variables. • The horizontal axis is called the x-axis. • The vertical axis is called the y-axis. • The point of intersection of the x-axis and y-axis is called the origin. • The axes divide the Cartesian Plane into four quadrants. • An ordered pair is a single point on the Cartesian Plane. Ordered pairs are of the form (x,y) where the first value is called the x-coordinate and the second value is called the y-coordinate.
Examples – Plot each if the following ordered pairs on the Cartesian Plane and name the quadrant it lies in:
Linear Equations in Two Variables • A linear equation in two variables is an equation of the form Ax + By = C where A, B, and C are real numbers. • The form Ax + By = C is called the standard form of a linear equation in two variables. • Anordered pairis a solution to a linear equation in two variables if it satisfies the equation when the values of x and y are substituted.
Examples – Determine if the ordered pair is a solution to each linear equation: • a. 2x – 3y = 6; (6, 2) • b. y = 2x + 1; (-3, 5) • c. 2x = 2y – 4; (-2, -8) • d. 10 = 5x + 2y; (-4, 15)
Examples – Find the missing coordinate in each ordered par given the equation: • a. -7y = 14x; (2, __ ) • b. y = -6x + 1; ( ____, -11) • c. 4x + 2y = 8; (1, __ ) • d. x – 5y = -1; ( ____, -2)
Complete the table of values for each equation: • y = 2x – 10x + 3y = 9
Graphing Linear Equations in Two Variables • The graph of an equation in two variables is the set of all points that satisfies the equation. • A linear equation in two variables forms a straightline when graphed on the Cartesian Plane. • A table of values can be used to generate a set of coordinates that lie on the line.
Intercepts • An intercept is a point on a graph which crosses an axis. • An x-intercept crosses the x-axis. The y-coordinate of any x-intercept is 0. • A y-intercept crosses the y-axis. The x-coordinate of any y-intercept is 0.
Horizontal and Vertical Lines • A horizontal line is a line of the form y = c, where c is a real number. • A vertical line is a line of the form x = c, where c is a real number.
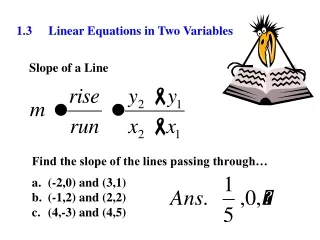
Slope of a Line • The slope of a line is the degree of slant or tilt a line has. The letter “m” is used to represent the slope of a line. • Slope can be defined in several ways: • Examples - Find the slope of each line: • a. Containing the points (3, -10) and (5, 6) • b. Containing the points (-4, 20) and (-8, 8)
Slopes of Horizontal & Vertical Lines • The slope of any horizontal line is 0 • The slope of any vertical line is undefined • Examples – Graph each of the following lines then find the slope • x= -3 3y -2 = 4
Slope-Intercept form of a Line • The slope-intercept form of a line is y = mx + b where m is the slope and the coordinate (0,b)is the y-intercept. • The advantage equation of a line written in this form is that the slope and y-intercept can be easily identified.
Examples – Find the slope and y-intercept of each equation: • a. y = 3x – 2 • b. 4y = 5x + 8 • c. 4x + 2y = 7 • d. 5x – 7y = 11
Parallel and Perpendicular Slopes • Two lines that are parallel to one another have the following properties • They will never intersect • They have the same slopes • They have different y-intercepts • Parallel lines are denoted by the symbol // • Two lines that are perpendicular to one another have the following properties: • They intersect at a angle • The have opposite and reciprocal slopes • Perpendicular lines are denoted by the symbol ┴
Examples – Determine if each pair of lines is parallel, perpendicular, or neither: • a. 2y = 4x + 7 b. 5x – 10y = 6 y – 2x = -3 y = 2x + 7 • c. 3x + 4y = 3 d. Line 1 contains points (3,1) and (2,7) 4x + 5y = -1 Line 2 contains points (8,5) and (2,4)