Download
1 / 22
550 likes | 1.54k Vues
Electrical Conduction in Myocardial Cells . Figure 14-17. 1. 1. SA node. AV node. 2. 1. THE CONDUCTING SYSTEM OF THE HEART. SA node depolarizes. 2. Electrical activity goes rapidly to AV node via internodal pathways. SA node. 3. Internodal pathways. 3. Depolarization spreads

E N D
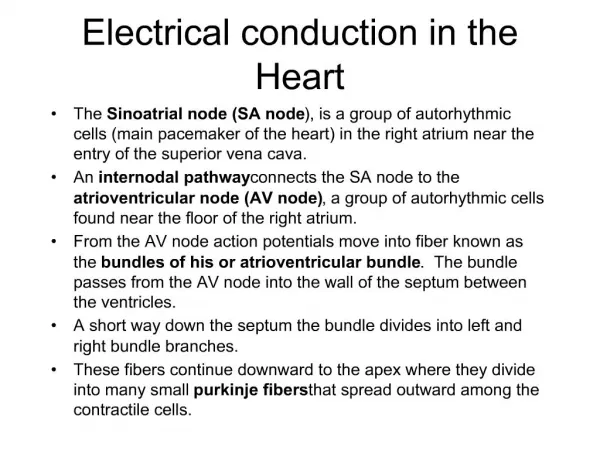
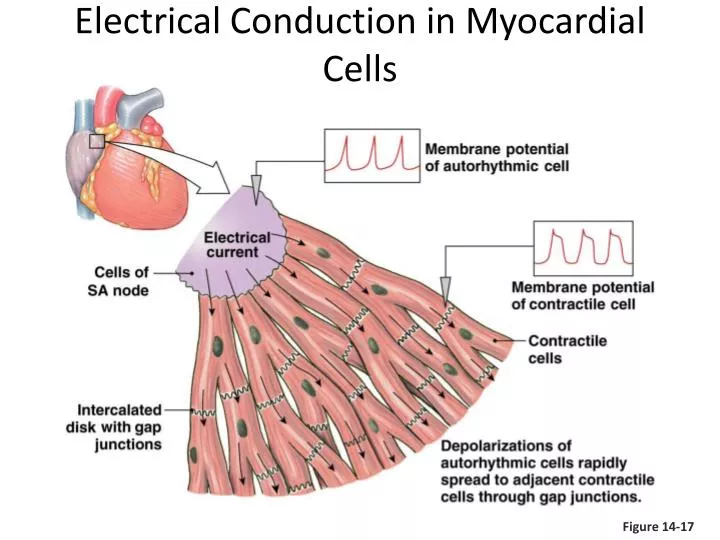
Electrical Conduction in Myocardial Cells Figure 14-17
1 1 SA node AV node 2 1 THE CONDUCTING SYSTEM OF THE HEART SA node depolarizes. 2 Electrical activity goes rapidly to AV node via internodal pathways. SA node 3 Internodal pathways 3 Depolarization spreads more slowly across atria. Conduction slows through AV node. AV node 4 Depolarization moves rapidly through ventricular conducting system to the apex of the heart. A-V bundle 4 Bundle branches Purkinje fibers Depolarization wave spreads upward from the apex. 5 5 Purple shading in steps 2–5 represents depolarization. Electrical Conduction in Heart
1 1 SA node AV node 1 THE CONDUCTING SYSTEM OF THE HEART SA node depolarizes. SA node Internodal pathways AV node A-V bundle Bundle branches Purkinje fibers Purple shading in steps 2–5 represents depolarization. Electrical Conduction in Heart The electrical signal for contraction begins when the SA node fires an action potential and the depolarization spreads to adjacent cells through gap junctions Figure 14-18, step 1
1 1 SA node AV node 2 1 THE CONDUCTING SYSTEM OF THE HEART SA node depolarizes. 2 Electrical activity goes rapidly to AV node via internodal pathways. SA node Internodal pathways AV node A-V bundle Bundle branches Purkinje fibers Purple shading in steps 2–5 represents depolarization. Electrical Conduction in Heart Electrical conduction is rapid through the internodal conducting pathways , but slower through the contractile cells of the atria Figure 14-18, steps 1–2
1 1 SA node AV node 2 1 THE CONDUCTING SYSTEM OF THE HEART SA node depolarizes. 2 Electrical activity goes rapidly to AV node via internodal pathways. SA node 3 Internodal pathways 3 Depolarization spreads more slowly across atria. Conduction slows through AV node. AV node A-V bundle Bundle branches Purkinje fibers Purple shading in steps 2–5 represents depolarization. Electrical Conduction in Heart Figure 14-18, steps 1–3
1 1 SA node AV node 2 1 THE CONDUCTING SYSTEM OF THE HEART SA node depolarizes. 2 Electrical activity goes rapidly to AV node via internodal pathways. SA node 3 Internodal pathways 3 Depolarization spreads more slowly across atria. Conduction slows through AV node. AV node Depolarization moves rapidly through ventricular conducting system to the apex of the heart. 4 A-V bundle 4 Bundle branches Purkinje fibers Purple shading in steps 2–5 represents depolarization. Electrical Conduction in Heart Figure 14-18, steps 1–4
1 1 SA node AV node 2 1 THE CONDUCTING SYSTEM OF THE HEART SA node depolarizes. 2 Electrical activity goes rapidly to AV node via internodal pathways. SA node 3 Internodal pathways 3 Depolarization spreads more slowly across atria. Conduction slows through AV node. AV node 4 Depolarization moves rapidly through ventricular conducting system to the apex of the heart. A-V bundle 4 Bundle branches Purkinje fibers Depolarization wave spreads upward from the apex. 5 5 Purple shading in steps 2–5 represents depolarization. Electrical Conduction in Heart Why is it necessary to direct the electrical signals through the AV node? Why not allow them to spread downward from the atria?
FIBRILLATION If myocardial cells contract in a disorganized manner-fibrillation results. Atrial fibrillation –Not a immediateemergency condition. Ventricular fibrillation,- is an immediately life-threatening emergency. • Treatement- • electrical shock to the heart. The shock creates a depolarization that triggers action potentials in all cells simultaneously, coordinating them again.
Electrical Conduction • AV node • Direction of electrical signals • Delay the transmission of action potentials • SA node • Set the pace of the heartbeat at 70 bpm • AV node (50 bpm) and Purkinje fibers (25-40 bpm) can act as pacemakers under some conditions
Complete heart block- The conduction of electrical signals from the atria to the ventricles through the AV node is disrupted. The SA node fires at its rate of 70 beats per minute, but those signals never reach the ventricles. So the ventricles coordinate with their fastest pacemaker. Because ventricular autorhythmic cells discharge only about 35 times a minute, the rate at which the ventricles contract is much slower than the rate at which the atria contract. • If ventricular contraction is too slow to maintain adequate blood flow, it may be necessary for the heart's rhythm to be set artificially by a surgically implanted mechanical pacemaker. These battery-powered devices artificially stimulate the heart at a predetermined rate.
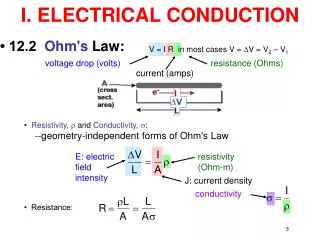
Electrocardiography: Introduction • Body fluids are good conductors (the body is a volume conductor) • Fluctuations in potential (action potentials of myocardial fibers) can be recorded extracellularly • The record of these potential fluctuations during the cardiac cycle is the electrocardiogram (ECG) • The ECG provides information on: - • -Heart rate and rhythm - The pattern of electrical activation of the atria and ventricles - The approximate mass of tissue being activated - Possible damage of the heart muscle - Possible changes in the body’s electrolyte composition
Basic Concept One in Electrocardiography: The ECG reflects changes in the charge on the surface of the heart • When a heart cell is at rest, the inside of the cell is negative relative to the outside, which is positive • However, when an action potential is generated, the inside becomes positive and the outside negative • So, at rest, the outside of the heart is positive, but as an action potential passes, the surface becomes negative • This change in surface charge is recorded in an ECG
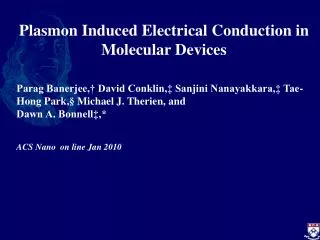
Since the AP begins at the SA node, this is the first part of the heart where the surface becomes negative. The rest of the heart is still at rest so its surface is still positive • This produces a charge difference on the surface (between the negative SA node and the other positive parts of the heart) • The difference in surface charge between two areas of the heart is equivalent to oppositely charged poles (known as a dipole). One pole at the SA node would be negative and the other pole at the ventricle would be positive • As the AP is conducted through the remainder of the heart there is an associated wave of negative charge that sweeps over the surface of the heart
Fig. 2. Principles of the bipolar recording of an action potential
If recording electrodes are placed over different points of the body, they will measure this difference in surface charge • When the SA node repolarizes, the heart surface will once again become positive above the SA node, but will still be negative in the remainder of the heart • This will cause the dipole to reverse. Now the positive end is over the SA node and the negative end is over the ventricle
Recording the Electrocardiogram. Basic concept two in Electrocardiography: When the wave of depolarization moves toward the positive electrode, an upward deflection is recorded, whereas depolarization moving in the opposite direction produces a negative deflection • Einthoven’s triangle • hypothetical triangle created around the heart when electrodes are placed on both arms and the left leg .The sides of the triangle are numbered to correspond with the three leads ("leeds"), or pairs of electrodes.
Einthoven’s Triangle Figure 14-19
Important features of the ECG are the P wave, the QRS complex and T wave. • Relevant intervals and segments are the PR interval, the RR interval, the QT segment and the ST segment.
P wave: Atrial depolarization as recorded from the surface of the body P – R interval: Time taken for the wave of depolarization to move through the atria, AV node, bundle of His, Purkinje fibres to the ventricular myocardium. QRS complex: Depolarization of the ventricles. ST segment: Marks the end of the QRS complex and the beginning of the T wave. It occurs when the ventricular cells are in the plateau phase of the action potential (i.e. there is no change in potential occurring and so the ECG baseline is at zero potential) T wave: Repolarization of the ventricles (due to potential changes occurring during phase 3 of the cardiac action potential) Q – T interval: Period during which ventricular systole occurs R – R interval: This time is usually used to calculate the heart rate.
P wave: atrial depolarization START P The end R PQ or PR segment: conduction through AV node and A-V bundle T P P QS Atria contract. T wave: ventricular Repolarization ELECTRICAL EVENTS OF THE CARDIAC CYCLE Repolarization R T P QS Q wave P Q ST segment R R wave P R Q S P R Ventricles contract. Q P S wave QS Electrical Activity Correlation between an ECG and electrical events in the heart Figure 14-21
Electrical Activity Comparison of an ECG and a myocardial action potential Figure 14-22
Electrical Activity Normal and abnormal electrocardiograms Figure 14-23