Download

1 / 42
530 likes | 844 Vues
Human Capital and the Returns to Education. Human Capital. HC: inherent of acquired talent that has economic value in the labor market. Population HC affects aggregate output. HC acquired in schools (public policy) The US spends 6.5% of GDP on education. Some facts:

E N D
Human Capital • HC: inherent of acquired talent that has economic value in the labor market. • Population HC affects aggregate output. • HC acquired in schools (public policy) • The US spends 6.5% of GDP on education. • Some facts: • Wages (unempl.) increase (decreases) with schooling • Young workers switch jobs a lot. • There is a long right tail to wage distribution.
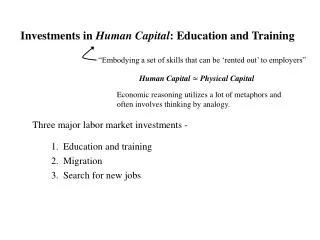
Human Capital as Investment (Becker) • Schooling is investment with opp. costs. • Credit constraints effects. • Mincer: how to estimate the return. • But HC is different from other investments: • Hard to transfer property rights, can’t use as collateral • Hard to diversify • Non-pecuniary returns. • General vs. firm-specific HC.
The Individual Decision to Acquire education: College vs. High School • College takes 4 years, increases earnings from E(0) to E(1), pay tuition T, interest rate i. • Cost: opp. costs + direct costs = E(0)+E(0)/(1+i)+…+E(0)/(1+i)3+T[1+1/(1+i)+…] • Benefit: [E(1)-E(0)]/(1+i)4+…+ [E(1)-E(0)]/(1+i)47(work from 18 to 65) • High i means college is less attractive. Assume E(0)=18, E(1)=E(0)*1.25, T=6, PDVs are equal at roughly i=r=0.035 so with 25% college wage gain, get college if cost of funds is below 0.035.
The Individual Decision to Acquire s years of education • Assume earnings if haves years of (post-compulsory) schooling is W(s) • Assume only cost of education is forgone earnings – no direct cost • Assume everyone lives for ever • PDV of s years of education is:
The education decision (cont) • Taking logs this can be written as: • The first order-condition can be written as: • i.e. acquire education up to the point where the increase in log earnings is equal to the rate at which future earnings are discounted
Equilibrium • Suppose all individuals identical, but they require different levels of S in equilibrium • Then it must be the case that their Is equalized for different levels of S, such that log(W(S)-log(W(S-1))=r(S-(S-1))=r • Think of including years of education on RHS of earnings function – coefficient on S is measure of r – rate of return to education • This earnings function is a labour supply curve
An Example • Two types of labour – college educated and high-school educated. • College educated require 4 years of education
Wc/Wh Supply Demand Nc/Nh Model of the economy as a whole
Things to note • Return to education supply-determined – determined by r • Can think of it as a compensating differential for the time taken to acquire education • Demand shifts have no effect on r • Supply of educated labour perfectly elastic – may be true in long-run but not in short-run • People acquire skills after school (experience): ln(Wi)=6.2+0.10Si+0.08Expi-0.001Expi2 , R2 =0.29
Estimates of rate of return to education • For US a typical OLS estimate from an earnings function is about 8% • Other countries are a bit different • Suggests education a very good investment – few other investments offer an 8% real return. • Private and social returns may differ.
Estimates of rate of return to education for other countriesTrostel, Walker, Woolley, Labour Economics 2002)
A puzzle • If rate of return to education is so high, why aren’t more people acquiring education • Possible answers: • Liquidity constraints • Bias in OLS estimate so rate of return not really that high • Heterogeneity in the returns to education
Liquidity Constraints • In perfect capital market r should be rate of interest • But if imperfect capital market may be much higher. • Why might it be higher – hard to borrow money against human capital as no collateral
Bias in OLS estimate • Why might OLS estimate be biased? • Most common answer is ‘ability bias’ • Ability has effect on wages independent of education but is positively correlated with schooling and typically not controlled for in regression. • Suppose true model is:
But a is omitted from regression so estimate: • Standard formula for omitted variables bias gives us that: • So that OLS estimate biased upwards if a and s are positively correlated (as is very likely)
Solutions to Omitted Ability Bias Problems • Put in better controls for ‘ability’ e.g. use of IQ tests etc • Twin studies • Instrumental Variables
Twin studies • Pioneered by Taubman (AER, 1976) • Simple model for earnings of twin 1 and twin 2 in pair i • Cannot estimate by OLS as s may be correlated with a • but assume that identical twins have a1i=a2i
Take differences: • Now regressor uncorrelated with error so estimate will be consistent • Estimate from twins studies typically suggest lower rate of return to education than OLS – suggestive of ability bias
Problems with Twin Studies • Do identical twins really have identical ability – identical genes but perhaps not everything in the genes • Measurement error problems – measurement error leads to attenuation bias, measurement error like to be bigger in Δs than s as identical twins tend to have similar levels of schooling
The Instrumental Variable Approach • Basic idea of IV in this context: find instrument(s) correlated with S but uncorrelated with a • A number of studies have used different instruments • quarter of birth (Angrist-Krueger QJE 91) • proximity to a college (Card) • Changes in minimum school leaving age (Harmon-Walker AER 95) • month of birth (del Bono and Galindo-Rueda) • Often find higher estimates than OLS
Look at one in more detail (del Bono an dgalidno-Rueda) • The idea – until 1977 UK compulsory schooling laws allowed those in a school cohort born between 1st Sept and 31st January to eave school at Easter and not take exams. • This had the effect of reducing the probability of getting an academic qualification for those born before February
Comment • Note: use employment as outcome variable as do not have large enough sample size to estimate precise wage effects • So cannot use results directly to compute rate of return to education • But idea should be clear
LATE vs ATE: Oreopoulos 2006 Rising minimum school-leaving age in the UK from 14 to 15 made half the population stay in school for one more year. Use this experiment to see if LATE effects based on compulsory schooling in the US (where only small groups are affected) compare to ATE. Finds that benefits from compulsory schooling are large whether these laws have an impact on a majority or minority.
Heterogeneity in Returns to education (Card, JOLE 1999) • Uses idea that there is likely to be heterogeneity in both return to school and the cost of schooling (the discount rate) • Assume that the earnings function for individual i is given by: • with marginal return to schooling:
Assume marginal costs are given by: • Equate MC and MB to get the optimal level of schooling for individual i: • bi is about variation in ability to gain from schooling, ri is about access to funds. • ATE=β=E[bi –k1Si*] (do we care about ATE?) • Now try estimate the earnings function: • The last two terms will become the ‘error’.
This expression makes clear there are two potential sources of bias in OLS estimation • the correlation of ai with Si - ability bias • the correlation of (bi-b) with Si e.g. if those with high returns get more schooling. • Assume that: where lambda is the usual ‘ability bias’ • And that: psi is the ‘comparative advantage bias’ arising from differences in gains from schooling across people (the E[.] term is multiplied by Si)
So: • Then using the fact that the expectation of the quadratic term has slope S-bar we have: • where β-bar is the average of the marginal returns to schooling in the sample (ATE) and the sources of bias are clear.
What does IV estimate when returns are heterogeneous • This is a surprisingly complicated question • Angrist-Imbens LATE tells us that it picks up the average returns for education for those whose behaviour is altered by the instrument • Unlike IV estimate for homegenous case this means estimate will vary with the instrument • This issue comes up in other areas where IV is increasibly popular
Card’s conclusions on returns to education • Average rate of return probably only slightly below OLS estimate • There is some variation in return to education with observable factors • IV estimates tend to be bigger than OLS maybe because the IVs exploited pick up the returns for a group for whom it is large (credit constrained). • Heckman disagrees: we all have the same opportunity (ri) and bi is determined in early age.
There is much ongoing work on credit constraint effects • First, college proximity may be invalid IV due to family choice and quality of high-schools (AFQT). • Still, children of families in top (bottom) income quartile have 75% (45%) chance of attending a college. This could be because of • College tuition credit constraints • Long-run family income effects on HC formation • The two types of credit constraints have different policy implications. (Cameron & Heckman; Kane)
Other issues in the returns to education • Have focused on quantity of schooling but quality and type of schools also important – e.g. what is effect of class sizes • Jayachandran & Lleras-Muney QJE 2009: longer life expectancy (of girls in SriLanka) raises educ. investment (relative to boys’) • Why does education raise earnings? Two main models: it (a) raises human capital, and/or (b) acts as a signal (Spence).
Signaling Model – the Basic Idea • Hard for employers to observe productivity • Good workers want to convey this information to employers • But talk is cheap so saying you are good is not credible • Acquiring education may be a credible signal if less costly to acquire for the highly productive
Testing the Signaling Model- Altonji and Pierret • Basic idea is that information problem most acute for young workers but employers learn true ability over time • Implication is that ability measure initially unobservable to employers should become more important in explaining wages over time while variables (e.g. education) that are initially used as signal should become less important • Generally hard to implement because rare to have variable observed by econometrician but not by employer (typicallly they know more than we do)
Altonji-Pierret use fact that NLSY has AFQT measure for teenagers as measure of ability • Main results are on next slide – they are quite striking • Suggest that part though not all of apparent return to education is from signalling
Marriage & Returns to Education • There is positive sorting on education in marriage (even among Hollywood actors who do not meet their spouses in school and whose wages don’t depend on education, Bruze, 2008). • Why? Household public goods, complementarity. • A high share of returns to education is realized through marriage. Bruze (2008): Time use study: “better” marriage generates 65% (20%) of the return to education for women (men) at age 40.
Health Returns to Education • Deaton (NBER 2003): richer, better-educated people live longer: top 5% of income have 25% longer life expectancy than bottom 5% in the US. • Two-way channel (health info, risky behavior,…) • Both money and education help. • Much of Education=>Health happens in childhood • Oreopoulos & Salvanes (2009, NBER): schooling makes one enjoy work, make better decisions about health, marriage, and parenting. It also improves patience, trust and social interaction.