Download
1 / 17
170 likes | 319 Vues
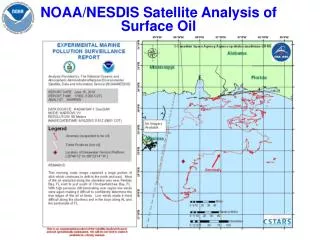
NOAA NESDIS satellite products for fire risk assessment Peter Romanov 1,2 1 NOAA Cooperative Remote Sensing Science and Technology Center (CREST), City College of City University of New York (CUNY) 2 Center for Satellite Applications and Research, NOAA/NESDIS. BACKGROUND.

E N D
NOAA NESDIS satellite products for fire risk assessment Peter Romanov1,2 1NOAA Cooperative Remote Sensing Science and Technology Center (CREST), City College of City University of New York (CUNY) 2 Center for Satellite Applications and Research, NOAA/NESDIS
BACKGROUND • NESDIS does not operationally monitor fire risk or fire danger • Several NESDIS environmental products can be used for assess fire potential/danger • Our presentation gives a review of these products, their accuracy and availability
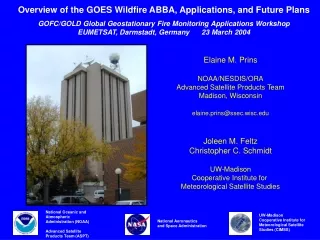
FIRE DANGER/RISK INDICES • Indices used (partial list) • Keetch-Byram Drought Index, KBDI (USA, Canada) • Nesterov, NI (Russia) • Zhdanko, ZhI (Russia) • McArthur Forest Fire Danger Index, FFDI (Australia) • Primary input to indices calculation • Temperature, rainfall, humidity, wind speed • Duration of adverse weather conditions leading to drought/fires (cumulative dryness) • Additional information that may be used • Vegetation cover condition, soil moisture, snow cover
FIRE INDICES AND FIRE STATISTICS From Groisman et al, 2007
PRECIPITATION PRODUCTS • Vis/IR -based • Microwave-based • Combined All products are derived at daily or shorter time step Coverage is continental to global
SOIL MOISTURE BASICS Physics: Soil moisture is related to surface microwave emissivity • Few instruments have sufficiently low frequencies (≤10 GHz) to have the desired sensitivity: • AMSR-E: 6.9 and 10.7 GHz • TRMM Microwave Imager (TMI): 10.7 GHz • WindSatCoriolis: 6.8 and 10.8 GHz • ESA SMOS MIRAS: 1.4 GHz • Higher frequencies less sensitive to soil wetness, have smaller penetration depth. • Soil moisture retrievals over heavily vegetated areas (e.g., rain forest) are very limited
Soil Moisture Products and Data • The Soil Moisture Operational Processing System (SMOPS) is being developed at NOAA to provide operational real-time soil moisture products at 6-hour and daily time scales on a 0.25-degree lat/lon grid. • SMOPS will combine soil moisture retrievals from several sensors SMOS, AMSR-E, and ASCAT. • Operational deployment is planned for August 2011.
SNOW COVER • Daily snow cover maps are derived daily at 4 km spatial resolution • Two type of techniques: interactive and automated • Both visible infrared and microwave observations are used for snow mapping • Rate of agreement to surface snow cover estimates is about 90% Global automated snow/ice maps http://www.star.nesdis.noaa.gov/smcd/emb/snow/HTML/multisensor_global_snow_ice.html NH Interactive snow/ice maps http://www.natice.noaa.gov/ims/
SNOW SEASON VS FIRE SEASON • Fire season starts ~2 weeks after snow melt • Earlier snow melt in 1980s as compared to 1970s translated into earlier start of fire season.
SURFACE TEMPERATURE AND NDVI • AVHRR-based • Smoothed • Weekly, global • 4 km resolution • Available since 1982 • Used to identify drought conditions
DROUGHT IDENTIFICATION • Temperature much above average • NDVI much below average • Drought condition • Compare current temperature and NDVI with average historical values for the same week of the year
FIRE RISK • Duration of persistent drought conditions • Fire risk • Week 34, 2009 • Week 34, 2010 • Climatology-based approach for fire risk assessment is less efficient in areas where fires occur every year (e.g., Turkey)
VEGETATION COVER LINK • Climatology-based approach for fire risk assessment is less efficient in areas where fires occur every year (e.g., Turkey) • Only occasional qualitative validation of the fire risk products is performed • http://www.star.nesdis.noaa.gov/smcd/emb/vci/VH/vh_browse.php
SUMMARY • Products are global or large scale. Therefore their application has most advantages in large-scale fire-related assessments. • - • Satellites do not provide all information needed to calculate standard fire danger indices.