Download
1 / 51
510 likes | 610 Vues
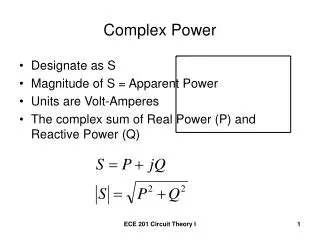
The Power System as a Complex Network. Jim Thorp June 2, 2011. C haos. The fact that a power system could, in principle, behave chaotically was established in 1982. 1

E N D
The Power System as a Complex Network Jim Thorp June 2, 2011
Chaos • The fact that a power system could, in principle, behave chaotically was established in 1982.1 • It was generally believed that the protection and control systems keep the actual power system from steady state chaotic behavior. • 1Chaotic motions in the two-degree-of-freedom swing equations • Kopell, N.; Washburn, R., Jr.; Circuits and Systems, IEEE Transactions on Volume: 29 , Issue: 11
Outline: I Chaos The fact that the power system has the basic structure required for complicated dynamic behavior manifests itself in other ways. • Bifurcations in power systems. • Voltage Collapse - bifurcation • Hopf bifurcation • Fractal domains for load flow solutions, • Truncated fractal domains of attraction of equilibria, • Transient chaos • Power law behavior same system for 35 years II DOE Demonstration Projects
Voltage Collapse • Most major disturbances exhibit voltage instability in addition to real power imbalance. 1997 West Coast, 2003 North East • Associated with lack of reactive power • In 1980’s Tokyo experienced a pure voltage collapse.
Voltage collapse - Nose Curves I1 Load increased at constant power factor V2 e jq2 V2 V1e jq1 V1 X SD
Voltage Collapse • As load increases |V2| Voltage control works correctly Voltage control inverse PD
Nose Curves: V1=1, X=0.5 V2 PF=.94 leading PF=.97. PF=1 PF=.97 PF=.94 lagging PD
Voltage Instability From the nose curve there is a maximum amount of power that a line can transfer before voltage stability becomes an Issue.
Analysis and Simulation of the Rush Island Event 32 minutes – operator could not stop the oscillation • HopfBifurcation • June 12, 1992 in Rush • Island Missouri Fault resulted in a sequence of events that ultimately led to the event Angle degrees Speed (pu) 3 cycle Fault at Tyson Rush Island
Load Flow Fractals Revisited* Florida equivalent Georgia equivalent 5 6 7 2 Gen 1 is the reference 2 1 1 fault 3 4 3 real machine J.S. Thorp and S.A. Naqavi, “Load Flow Fractals” Proceedings of the 28th CDC, Tampa, Florida December 1989, pp 1822-1827
750x750 or 562500 load flow solutions color coded by what equilibrium mod(2p) you converge to from each initial starting point q3 q2
Self Similara fractal Spacing 0.48 o Times 2p Times 10 Spacing 0.01146 0
PEBS potential energy boundary surface bowl mountain saddle saddle Fault on trajectory Type 1 Type 2 Type 1 stable
Boundary of the domain of attraction of the stable equilibrium 4p 0 4p 0
Fractal Forest with Lakes(tree heights =Number of iterations) The “lakes” are the solid colors areas < 5 iterations Trees get taller if stopping criteria is stricter
Truncated Fractal 562,500 simulations color coded by ultimate equilibrium • M. Varghese and J. S. Thorp, "Truncated-Fractal Basin Boundaries in Forced Pendulum Systems," Phys Rev Letters Vol. 60, No. 8, pp 665-668, February 1988
The exact boundary of the stability boundary is composed of trajectories that are smooth in R4 but a slice in R2 for x3(0)=g and x4(0) =0 is the truncated fractal
The Power System Has a Protection System(like your house) • Circuit Breakers (interrupt 63,000 amps) • Relays (Inputs from local Current and Voltage Transformers and from communication channels - output trip signals to circuit breakers) Electromechanical (30’s) Solid State (60’s) Microprocessor-based (late 80’s and 90’s) Distributed Intelligence - Utility IntraNet LAN and Routers in substations, fiber on right-of-way • In the US system 5,000,000 relays 60% legacy analog
Fault clearing in 3 cycles = 1/20 of a secondHigh speed reclose in 20 cycles = 1/3 of a second The protection system was designed to protect equipment – why? – system was overbuilt. The system would work with a line out. Damaged equipment meant customers out of service - high cost. Multiple primary (3 on transmission lines) protection and layers of backup protection. Backup of a backup A relay can do two things wrong – trip incorrectly or fail to trip. dependability is "the degree of certainty that a relay or relay system will operate correctly",. Security "relates to the degree of certainty that a relay or relay system will not operate incorrectly The current system is dependable at the expense of security – trigger happy NERC data: relays involved as contributing factor in 2/3 of major disturbances
Hidden Failures • The “dark side of robustness” • Defect or error in relay that does not manifest itself immediately but which can causes a miss-operation when the system is stressed. • Largest single cause is maintenance (42% 1977 NYC blackout bent contact). The Internet also has hidden failures caused by maintenance. • Northeast Blackout 1965, NY City Blackout 1977, WECC summer of 1996, August 2003
1 year 10 years > .7 million customers > 7 million customers On average, once every 1 Note: 50 million every 35 years added Aug 2003 10 NERC data 0 10 -1 10 Aug 10, 1996 -2 10 104 105 106 107 there will be an outage of John Doyle Cal Tech
1 year 10 years > .7 million customers > 7 million customers On average, once every 35 years > 50 million customers 2003 – 1965 = 38 years 1 Note: 50 million every 35 years added Aug 2003 10 NERC data 0 10 Essentially the same power system in 1965 and 2003 -1 10 24 people NBA and Bill Gates Aug 10, 1996 -2 10 104 105 106 107 there will be an outage of
MassoudAmin was at EPRI now University of Minnesota in Twin Cities
Power law “tail” of simulated power loss time series from hidden failure model • Fits NERC • data
2003 DOE report • I was on the data adequacy subcommittee of the DOE-Canada team. • Following begins well into the event and is focused on power flow after things got close to the end
Initial conditions for Aug 2003 1:30 pm Power Plants > 3000 MW2,000-3,000 MW1,000-2,000 MW450-1,000 MW < 450 MW DC . Voltage 765kV Beaver Valley
By 4:06 pmNext 10 slides 5 minutes of Kirchhoff and relays Increase ~100 MW 1,000 MW Reversal 500 MW Loading shifts to remaining paths. Akron and surrounding areas go dark. Alternate paths into Cleveland entail long 345kV paths or longer loops through PJM’s 500/230 system. 2,800 MW 1,900 MW -500MW Harding Juniper Chamberlain Hanna Star CantonCentral SouthCanton Columbus Muskingum 4:06 pm
Next Event: About three minutes later, the shortest paths from the supply region to Cleveland begin to break up. Two segments are lost that isolate Cleveland from the rest of Ohio. Kinder-Morgan-200MW -500MW Harding Juniper Chamberlain Hanna Star CantonCentral SouthCanton Muskingum 4:08 – 4:10 pm
Reaction: Increase 500-600 MW With all direct paths to Cleveland open, power flows up the 765kV network into western Michigan. Within 10 seconds of the two trips, flow thru Michigan goes up 2,000 MW. Voltage in Michigan and Ohio declines. 4,800 MW 3,700 MW 2,200MW -500MW Harding Juniper Chamberlain Hanna Star CantonCentral SouthCanton Muskingum 4:08 – 4:10 pm
Snapshot:4:10:38 PM Eastern Michigan is isolated with Cleveland. Voltage collapsing in Detroit/Cleveland. MCV -1265MW Kinder-Morgan-500MW -500MW -2174 MW Harding Juniper Chamberlain Hanna Star CantonCentral SouthCanton Muskingum 4:10:38 pm
Snapshot:4:10:38 PM DC Voltage 765kV Some load still remains in the isolated portion of the system, but the only way to flow from the supply region is through PJM & NY. Power surges into Ontario from NY. Remains of Eastern Michigan and Northern Ohio hang from Ontario. -2174 MW -500MW Beaver Valley Harding 4:10:38 pm
Next Event: DC Voltage 765kV Interface along northern Pennsylvania line opens. Remaining flow concentrates through New Jersey. -2174 MW -500MW Beaver Valley Harding 4:10:40 – 4:10:44 pm
Next Event: ? ? DC Voltage 765kV Cleveland separates. Remaining paths through NJ open,walling off NY and NE.Flow from south through NY stops. -2174 MW -500MW Beaver Valley Harding 4:10:42 – 4:10:45 pm
Next Event: DC Voltage 765kV -2174 MW -500MW Beaver Valley Harding Eastern NY, including NY City,separates from west NY and NE.West NY, now in surplus, flows into Ontario. New England rebalances as an island. Ontario shedding load. 4:10:46 – 4:10:55 pm
Next Event: DC Voltage 765kV Surplus! -2174 MW -500MW Beaver Valley Harding NY reportedly speeds up because of surplus generation, reaching a frequency of 63Hz. West NY plants shut down from over-frequency. 4:10:50 – 4:11:57 pm
Blackout - August 14, 2003 ~$6 billion lost due to 8/14/03 blackout Cost of Power Disturbances: $25 - $188 billion per year 4
Innovative Synchrophasor Research Will Provide Better Real-Time Information • August 21, 2009* WASHINGTON, DC – The Department of Energy’s Office of Electricity and Energy Reliability today announced that it will provide $4.3 million for four projects that will use innovative synchrophasor research to improve the reliability and efficiency of our Nation’s electricity grid. These awards are part of the Department’s efforts to modernize the electric grid and enhance the security and reliability of the energy infrastructure. • DOE announced it would commit $2.25M to this area. • It received 300+ proposals and elected to fund four. • Terms • Synchrophasor – a phasor measured with synchronous sampling - uses GPS • PMU phasor measuring unit *I stepped down as ECE Dept Head in Aug 2009-my second retirement
Virginia Tech has a prominent role in two of the four totaling $2.6M and a minor role in a third • The North American SynchoPhasor Initiative (NASPI) an entity created by DOE, NERC, PNNL, and LBNL has identified more than $1B committed to SynchroPhasor demonstrations and installations
US North American Synchrophasor Initiative NASPI http://www.naspi.org/ A road map NASPINet Obama announced 10/27/09 VT involved in two of these 850 PMUs
Why? NY Times June 8,2009 • On Feb. 26, 2008, a short circuit in a Miami electric power substation and an operator's error gave managers of the nation's electrical grids a glimpse of an uneasy future. The events triggered a chain reaction of power plant and transmission line outages in the state, unleashing sharp swings in voltages and power frequency that blacked out power for nearly 1 million customers in southern and central Florida for up to four hours. • A video depicting the Florida incident's rippling spread has been created by Virginia Polytechnic Institute and State University's electrical and computer engineering department, which caught the disturbance on its first-generation grid frequency monitoring network. Some grid executives have downloaded the video on their laptops as a kind of horror flick for engineers of what could happen.
q Imaginary q Real t=0 • Introduction to phasors - Steinmetz • The starting time defines the phase angle of the phasor. • This is arbitrary. • However, differences between phase angles are • independent of the starting time.
Substation A Substation B At different locations • Motivation for synchronization By synchronizing the sampling processes for different signals - which may be hundreds of miles apart, it is possible to put their phasors on the same phasor diagram.
Uses of PMUs • Monitoring – measure the state of the power system- it was estimated every few seconds • Can now be measured 60 times a second • Control • All control was based on local measurements and a mathematical model of the rest • Improved Protection • Keep relays from contribution to cascading outages
One of the two projectsAdaptive relaying • Use PMUs to sense if the system is under stress and guard against a trip due to a hidden failure • This will be done on a WECC line for the CIEE grant involving PG&E, SCE, SDG&E • We have shown that in 15000 cases ( all rare events) half of which would cause a major disturbance that the number can be reduced to less than 1%. Use data mining techniques
PMUPlacement: Reference
Second Project: The first three phase, tracking State Estimator for the Dominion Virginia Power 500kV network • Monitoring – • Measure the state of the power system 30 times a second to track the dynamics of the system • To examine imbalance issues it will be the first three phase estimator. Under balanced conditions one equivalent phase is conventional
Some Issues . • All of these present opportunities for cyber security problems. The conventional CS cyber security techniques developed for conventional computer and communication systems can not be applied blindly. The threats are different.
It is rumored that 60% of the one brand of digital relays installed still have the default factory password It is accepted that access through a digital relay was the entry technique used by the Idaho National Laboratory in the Aurora Project in 2007 to gain remote access to a $1 Million diesel-electric generator and destroyed it. The Aurora tape is at http://www.youtube.com/watch?v=fJyWngDco3g&feature=related “Once you’re in, and you know something about synchronizing systems it's all too easy to destroy the engine/generator coupling or the entire engine”
The positive side Jim McIntosh Director of Grid Operations, CAISO said in a JASONS Workshop in July 2010 in La Jolla that the stimulus PMUs being installed in California would save California from $200M to $300M a year.