Download
1 / 52
520 likes | 524 Vues
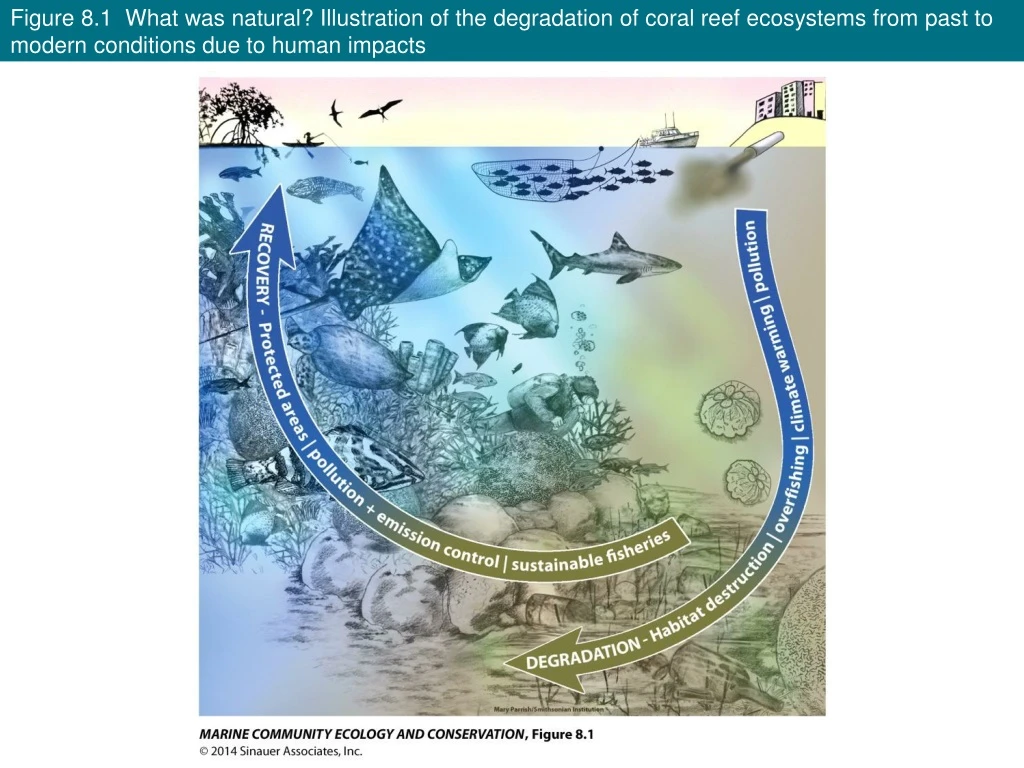
Figure 8.1 What was natural? Illustration of the degradation of coral reef ecosystems from past to modern conditions due to human impacts. Figure 8.2 Illustration of the shifting baseline syndrome and the change in living memory from old to young fishermen in the Gulf of California.

E N D
Figure 8.1 What was natural? Illustration of the degradation of coral reef ecosystems from past to modern conditions due to human impacts
Figure 8.2 Illustration of the shifting baseline syndrome and the change in living memory from old to young fishermen in the Gulf of California
Figure 8.3 The availability of data has exponentially increased over time
Table 8.1 Comparisons of data sources used by the different disciplines involved in marine historical ecology
Table 8.2 Different approaches to combining or comparing data to reconstruct the past
Figure 8.4 Uses of data from paleontological records (Part 1)
Figure 8.4 Uses of data from paleontological records (Part 2)
Figure 8.5 Uses of data from archaeological records (Part 1)
Figure 8.5 Uses of data from archaeological records (Part 2)
Figure 8.5 Uses of data from archaeological records (Part 3)
Figure 8.6 Historical records compared to modern records show a loss of nesting beaches and demonstrate the contraction of a range
Figure 8.6 Historical records compared to modern records show a loss of nesting beaches and demonstrate the contraction of a range (Part 1)
Figure 8.6 Historical records compared to modern records show a loss of nesting beaches and demonstrate the contraction of a range (Part 2)
Figure 8.7 Historical records show declines in fish catches (Part 1)
Figure 8.7 Historical records show declines in fish catches (Part 2)
Figure 8.8 Historical fisheries records from the outer Bay of Fundy
Figure 8.11 Living memory data based on interviews with fishermen of different ages in the Gulf of California
Figure 8.11 Living memory data based on interviews with fishermen of different ages in the Gulf of California (Part 1)
Figure 8.11 Living memory data based on interviews with fishermen of different ages in the Gulf of California (Part 2)
Figure 8.12 Recent increase of gray whales in the northeastern Pacific compared with different historical population estimates
Figure 8.13 Conceptual diagram of historical depletion and recovery trends
Figure 8.14 Historical changes in coral reef ecosystems (Part 1)
Figure 8.14 Historical changes in coral reef ecosystems (Part 2)
Figure 8.15 Historical changes in estuaries and coastal seas
Figure 8.15 Historical changes in estuaries and coastal seas (Part 1)
Figure 8.15 Historical changes in estuaries and coastal seas (Part 2)
Table 8.3 Definitions of cultural periods based on human presence, technology, and market conditions
Figure 8.16 Comparison of extinction risks for different taxonomic groups through time
Figure 8.17 Projecting future states of marine populations and ecosystems
Figure 8.17 Projecting future states of marine populations and ecosystems (Part 1)
Figure 8.17 Projecting future states of marine populations and ecosystems (Part 2)
Figure 8.18 Distinguishing natural from anthropogenic changes
Figure 8.18 Distinguishing natural from anthropogenic changes (Part 1)
Figure 8.18 Distinguishing natural from anthropogenic changes (Part 2)
Table 8.4 Past drivers of extinction in the ocean and current threats
Figure 8.19 The use of historical data affects extinction risk assessments and fisheries reference points
Table 8.5 Estimates of long-term change in shark populations in the Mediterranean Sea, with and without historical data
Figure 8.20 Three different ways of communicating the effects of overfishing on the size of fish to the general public
Figure 8.20 Three different ways of communicating the effects of overfishing on the size of fish to the general public (Part 1)