Download

1 / 74
740 likes | 959 Vues
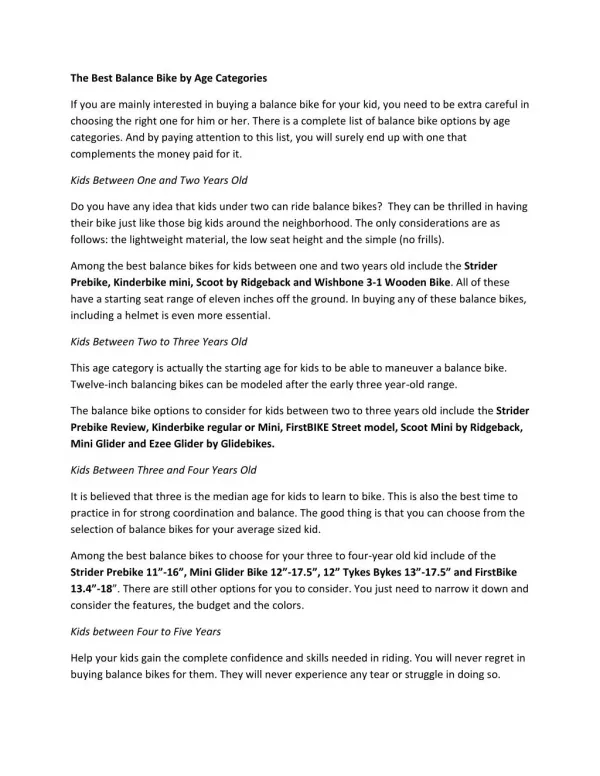
Segmenting Adult Web Users into Meaningful Age Categories. Robert W. Bailey, Ph.D. Computer Psychology, Inc. bob@webusability.com 801-201-2002. What are the 4 Most Useful Age Categories?. The Problem.

E N D
Segmenting Adult Web Users into Meaningful Age Categories Robert W. Bailey, Ph.D. Computer Psychology, Inc. bob@webusability.com 801-201-2002
The Problem • Virtually every study separates adult participants differently, i.e., designates different age segments • Without reading each individual study, practitioners do not know how old "old" is for each researcher • The goal is to have all researchers, who are doing work on ‘aging,’ use the same age categories • Example • Young: 20-35 • Middle-aged: 36-55 • Old: 56-75 • Old-old: 76 and over • What age segments are most useful to practitioners?
How Old is Old? • It is rumored that Otto von Bismark, Prime Minister of Prussia in the 1860’s introduced old age pensions • In preparation, he asked the mathematicians to determine the average age of death • They found that it was “55” • He said, “We’ll pay pensions at 65”
How Old is Old? • One prominent medical doctor recently made these observations on aging • “Aging begins at 30” • Organs begin to lose their function • Increase of heart disease, diabetes, arthritis, etc. • Bones begin to become brittle • “Many practicing physicians now refer to the elderly as those 75 and older, and the ‘old-old’ as those 85 and older”
The Influence of Age and Experience on Data EntryCzaja and Sharit, 1997 • Past research - Young people perform reliably better than older people on speed-related tasks • Data entry • File modification • Inventory management • This study - Participants were 110 people who performed a data entry task for three days • Young - Mean of 29.8 years • Middle - Mean of 49.4 • Old - Mean of 66.5 (Reliably less computer experience) • Results • Young and middle-aged users entered reliably more data than old users (p<.001) • No age-related differences with errors
Age, Luminance and Print LegibilityCharness and Dijkstra, 1999 • To survey homes, offices and public places • To determine existing ambient light levels • To assess whether ambient light levels in homes vary with the occupant’s age • To determine whether making changes to ambient light levels might improve the reading performance of older adults (intervention)
PAST RESEARCH • Study 1 - Older adults (aged 60-83) • Read serif fonts (Roman) 6% faster than sans serif fonts • The best reading speeds were attained with 14-point type • Study 2 - Older adults with an average age of 75 • Read using 14-point Times Roman and 9-point Helvetica • 14-point times was superior • Study 3 - Adults over age 50 were more strongly affected by low light levels than were people under 50 years of age
Study 1 • Participants were 98 Tallahassee residents • 31 young (20-38, average 29) • 33 middle-aged (39-58, average 47) • 34 older (over 58, average 69) • Performed five reading tasks • Results • The older group • Used reliably higher light levels • Read reliably slower than the younger groups • Adding lighting improved reading speed for all groups
Study 2 • Method • Visited 51 businesses • Measured the light level in work areas • Tested two people with reading tests • One over 40 • One under 40 • Results • Offices generally had adequate light levels • Only older users benefited from increasing the light level
Study 3 • Method • Visited 51 public places • Measured the light level in areas where people would read • Tested two people with reading tests • One over 50 • One under 50 • Results • The light levels in 71% of the locations were too low • Participants over age 50 read slower than those under 50
“Old” Defined • Past research • 60-83 • Average of 75 • Over age 50 • These studies • Mean of 66.5 • Over age 58 with an average of 69 • Over age 40 • Over age 50
Cognitive and Perceptual Training by Older and Younger AdultsMead and Fisk, 1997 • Investigated the type of information that should be presented during training • Young adults - Range of 18-30 (mean = 20) • Older adults - Range of 64-80 (mean = 69.9) • The groups showed no reliable differences on • Simple reaction time tests • Corrected vision tests
Young vs. Older Users • Young adults • Were more likely to have used an ATM (p<.0001) • Used computers more often (p<.0001) • Had higher scores on • Perceptual speed (p<.0001) • Reading rate (p<.05) • Reading comprehension (p<.0001) • Working memory capacity (p<.0001) • Had faster choice reaction times (p<.0001) • Older adults • Were better educated (p<.05) • Had higher vocabulary scores (p<.05)
How Old are Your Participants? An Investigation of Age Classifications Timothy A. Nichols, Wendy A. Rogers, Arthur D. Fisk, and Lacy D. West Georgia Institute of Technology Proceedings of the Human Factors and Ergonomics Society 45th Annual Meeting 2001
Introduction • Designers should try to account for age-related differences in their user populations • Gathered reported age data from all articles from two journals • Human Factors Journal: 1998-2000 • Psychology & Aging: 1995-1999 • Attempted to determine how researchers segmented their participants by age
Human Factors Journal • Human Factors Journal reported 131 empirical articles • 49 (37%) provided no age data at all • 64 (51%) supplied some information • 18 (14%) listed a mean, standard deviation and age ranges • Psychology & Aging reported 202 empirical articles
Results ClassificationHFP&A Older 58-76 62-82 Middle-aged 40-59 41-57 Young 19-35 19-30
Chronological Age • Cannot “cause” anything • Can help in defining the probability of occurrence of certain events
Age and Experience RelationshipsSri Kurniawan, Jason Allaire and Darin Ellis, 1999 • Examined the relationships among age, web experience and web ability • Participants were 600 older adults (average age of 44.3 years) • About 45% of the variance in Web ability was explained by the user’s age and experience • Web experience - 28% of the variance • Age - 9% of the variance • Shared age and experience - 8% of the variance
Longitudinal vs. Cross-Sectional Studies • Longitudinal - Compare the same individuals over time (historical effects) • Cross-sectional – Individuals are compared within their age groups • May belong to different age cohorts • May have had different life experiences • The findings from the two types of studies do not always agree
Studying the Effects Aging • Longitudinal • Measures the changes in one group of people over time • Usually considered superior to cross-sectional • Can be confounded by • Selection bias • Selective attrition • Retest familiarization • ‘Historical’ effects (see ‘world record’ times) • Cross-sectional • Evaluates for differences across the different age groups • Can be confounded by • Older adults being more cautious (work slower) • Major educational and experience differences • Slowing of the central nervous system over a certain age • Some differences can be the result of testing only survivors (those who have not yet died)
1912 10.5 seconds 1920 10.5 1924 10.2 1928 10.2 1932 10.2 1936 10.2 1948 10.2 1952 10.1 1956 10.1 1960 10.0 1964 10.0 1968 9.95 seconds 1972 9.95 1976 9.95 1980 9.95 1984 9.93 1988 9.86 1992 9.86 1996 9.84 2000 9.79 2004 9.78 World Record Timespersonal.rdg.ac.uk
Abilities and Age • Data from longitudinal studies will better measure age changes for those in • Good health, and • Stimulating environments • Data from cross-sectional studies tend to over estimate loss of most abilities • Cohort effects (e.g., differences in the amount of education) usually accounts for more variance than age-related factors
Six Ages of HumansPirow, 1994 • Birth • Starting age - The earliest age at which a measured activity can take place • Competence - The age at which a person has acquired the skill to perform well • Optimal - The age at which the person will perform optimally at the task • Initial decrease - The age at which the performance will start to decrease linearly • Rapid decrease - The age after which the performance will decrease at an increasing rate
Running Example FemaleMale Starting 2 years 2 years Competence 9 10 Optimal 22 24 Initial decrease 24 29 Rapid decrease 59 66
Correlation of Track and Field Performance with Chronological AgingFung and Ha, 1994 Correlation FemaleMale400 meters .98 .981500 meters .97 .96200 meters .95 .97800 meters .94 .985000 meters .94 .96100 meters .92 .94High jump .88 .91Discus .83 .78Shot put .81 .79Javelin .74 .94
General Decline in Older Adults • Sensitivity of most sensory organs • Attention capacities • Working memory • Speed of motor performance
Abilities and AgeWoolf, 1998 • Reliable decrements can not be found for all abilities for all persons (until very late in life) • Decline is most evident where ‘speed of response’ is involved • Declines will be evident in most abilities • For those in their 50s and 60s who live in deprived environments, and • For individuals of any age who have severe central nervous system disease (e.g., Alzheimer’s)
Common Age-Related Changes in Vision • Decreased sharpness of vision (visual acuity) • Decreased ability to focus on near objects • Decreased ability to focus on objects at varying distances (visual accommodation) • Decreased ability to discriminate between certain color intensities • Especially in the blue-green end of the color spectrum • The "yellowing" of the lens with age makes blues and greens appear "washed out" or faded • Decreased ability to perceive or judge depth • Decreased ability to focus in low light levels • Slow responsiveness to changes in light levels (dark to light, and light to dark) • Increased sensitivity to glare • Decreased ability to accurately judge distances • Increased need for light needed to see objects clearly
Comfortable Listening LevelsCoren, 1994 • The number of people who have difficulty hearing and understanding voices increases with age • General conversations • Voices on • The phone • Television • Radio • Computer • Procedure • Used 799 subjects, ranging in age from 17 to 92 • Each • Listened to a running speech signal • Identified the level preferred for listening
Results • The average `most comfortable listening level' for all participants was 63.4 dB • They found • No differences between left and right ears • No differences between male and female • Before the age of 40, the most comfortable listening level increased about 1/3 dB per year • After the age of 65, the most comfortable listening level increased about 1/2 dB per year
Reaction TimeFozard, 1990 • Shortens from infancy into the late 20s • Increases slowly until the 50s and 60s • Lengthens faster as a person gets into the 70s and beyond • Becomes more variable with age • When troubled by a distraction, older people tend to devote their exclusive attention to one stimulus and ignore another (attention)
Normal Distributions by AgeSlower Means and More Variability
Longitudinal Analysis of Age-Related SlowingFozard, et.al., 1990 • The Baltimore Longitudinal Study of Aging has been gathering data since 1959 • 1300 adults from 20 to 96 years of age • Continually evaluated using different measures • Biographical • Physiological • Psychological • One measure is reaction times • Simple – Responded to both high (1000 Hz) and low (250 Hz) tones presented for 3 seconds at 62 dBA • Disjunctive (choice) – Responded only to high tones
Results • Reaction time increases with age • Constant rate of slowing over the adult life span – appears linear • Slows from 10-20 milliseconds per decade (1-2 milliseconds per year) • Men remain reliably faster than women • There seems to be a general slowing of central nervous system functions with aging
Aging and Computer‑based Task PerformanceSharit and Czaja, 1994 • Of particular interest are age‑related changes in information processing abilities, including the • Senses • Cognition processors • Responders • There seems to be a general overall slowing in cognitive tasks • The hypothesized `slowing factor' for cognitive tasks is 1:1.6 (young vs. old)
Cognitive Abilities and Job Performance • There is little evidence that job performance declines with age • Age alone is not a significant predictor of performance in most actual work activities • Age effects are • Smaller for tasks where knowledge is an important aspect of the task • Larger for tasks where successful performance is primarily dependent on speed
Aging and ErrorsRabbitt, 1990 • Used a two-choice reaction time task • Four age groups • 19-30 • 50-59 • 60-69 • 70-79 • Conditions • No response to errors • Corrected each detected error • Signaled that an error was made (no correction)
Results • All age groups • Made the same percentage of errors • Were equally proficient at ‘automatic’ error detection • Underestimated the number of errors made (after the test) • The 70-79 group ‘signaled’ reliably fewer errors • The ability to remember errors after the test declined with age – beginning at age 50