Download

1 / 15
150 likes | 170 Vues
Explore the growth of traffic in Delhi, methodology of traffic flow mapping, volume counts, conclusions, and future applications for traffic management and pollution. Detailed presentation by Dr. K. Ravinder.

E N D
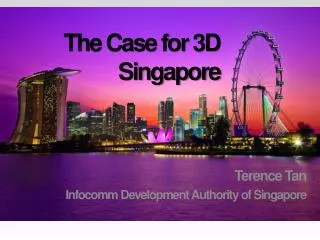
The Case for 3D Singapore Terence Tan Infocomm Development Authority of Singapore
Mapping of Traffic Flows on Delhi Road Network using Trans CAD Presentation by Dr. K. Ravinder Scientist Transport Planning and Environment Central Road Research Institute (CRRI), New Delhi (CSIR, India) 21st January, 2011
Presentation outline • Background • Mapping of Traffic flows, • Methodology • Data Collection (Traffic Surveys / Studies) • Traffic Volume Counts • Mid-blocks, • Intersections • Outer Cordon ( mid block surveys) • Traffic flows on various links • Conclusions
Growth of Population in Metropolitan Cities Delhi has more than 5% per annum (Mumbai: 3%,Kolkata: 2%, Chennai : 3%) Delhi has 1.3% of India Population (Area is only 0.05% of country) Presently Delhi has about 17.5 millions
Delhi Mumbai Growth Trend of Motor Vehicles in Four Mega Cities Kolkata Chennai Vehicle Pop in Delhi > Veh Pop (Mumbai + Kolkata+ Chennai) In 2008, Delhi has about 5.63 millions (more than 12%of India)
Growth Trend of Motor Vehicles in Delhi Two Wheelers more than 60% Cars about 30% Delhi has growth about 10% per annum Two wheeler growth is slightlymore than Cars
Locations of Traffic Surveys 24 Mid-blocks, 6 Intersections, 9 Outer Cordon and 30 Fuel Stations/ Parking Areas
Summary of Traffic Volume Counts at Selected Mid-block Locations Maximum Traffic Flow at ITO Bridge (Mid-block) 2.3 Lakhveh/day and NH-8 Toll Plaza (Outer Cordon) with 2.27 Lakhveh/day Summary of Traffic Volume Counts at Selected Intersections Maximum Traffic Flow at Ashram Chowk (Mid-block) with 3.65 Lakh veh/day (Flyover Traffic with 1.35 Lakh veh/day)
Typical Hourly Variation and Traffic Composition Total Vehicles : 1,92,395/day Lala Lajpath Rai Marg Total Vehicles : 3,64,871 vehicles/day (1,35,173 v/d flyover traffic) At Ashram Intersection
Pattern of External Traffic 4,31,246 4,64,183
Conclusions • High Traffic flows observed are observed at CBD areas and on Major National Highways • ITO bridge carries maximum traffic flow around 2.3 lac /day • NH8 Delhi- Gurgaon Expressway carries Maximum Traffic Flow 2.27 lac/day • Ashram Intersection carries maximum around 3.6lac/day • Future Applications • For Traffic Congestion management • For Traffic Pollution Loads from Traffic • For Dynamic Traffic Assignment