Download
1 / 3
30 likes | 121 Vues
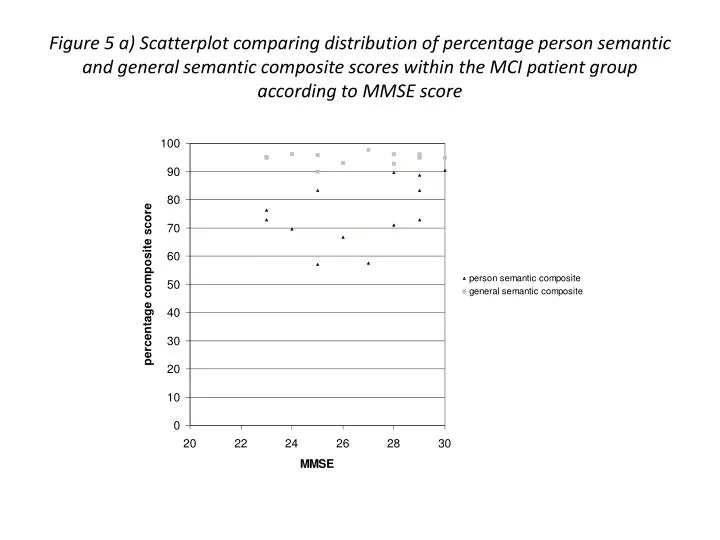
Figure 5 a) Scatterplot comparing distribution of percentage person semantic and general semantic composite scores within the MCI patient group according to MMSE score. Figure 5 b) Person semantic composite z-scores in the MCI patients.

E N D
Figure 5 a) Scatterplot comparing distribution of percentage person semantic and general semantic composite scores within the MCI patient group according to MMSE score
Figure 5 b) Person semantic composite z-scores in the MCI patients.
Figure 5c): General semantic composite z-scores in the MCI patients.