Download
1 / 26
270 likes | 412 Vues
Moment tensor analysis of acoustic emission data from a triaxial laboratory experiment. D. Kühn, V. Vavryčuk, E. Aker, F. Cuisiat, M. Soldal, K. D. V. Huynh 3rd Annual AIM Project Meeting, 10 – 12 Oct 2012, Smolenice, Slovakia. Motivation.

E N D
Moment tensor analysis of acoustic emission data from a triaxial laboratory experiment D. Kühn, V. Vavryčuk, E. Aker, F. Cuisiat, M. Soldal, K. D. V. Huynh 3rd Annual AIM Project Meeting, 10 – 12 Oct 2012, Smolenice, Slovakia
Motivation • growing interest in induced seismicity to monitor reservoirs (petroleum, geothermal, CO2 storage) • need to better understand induced seismicity associated with • rock deformation • failure of rock • reactivation of faults • reservoirs/surrounding formations • field data: • inadequate instrumentation • insufficent knowledge of velocity structure • poor data quality • laboratory experiment: • full control over receiver coverage • possibility of repeated measurements of axial and radial P- and S-wave velocities during experiment
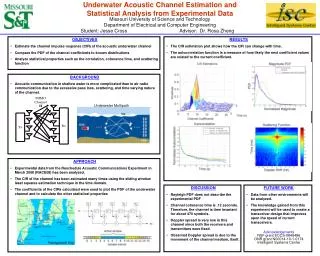
Objectives of the lab experiment • study initiation of micro-fractures and development of borehole breakouts • relate resulting acoustic emissions (AE) to: • fracturing process • associated source mechanism • macroscopic deformation of the sample • numerical modelling of sample behaviour/acoustic emissions using a particle flow code (not shown here)
Triaxial experiment • 12 1-C piezoceramic receivers: • full waveforms recorded • good coverage for event location and moment tensor inversion • dominant AE frequency: 500 kHz • sampling frequency: 10 MHz • typical AE wavelength: 10 mm • source dimension: < 1 cm • moment magnitude: < -4 • axial and radial P- and S-wave velocity: monitor anisotropy • axial and radial strain measurements: • relate AE activity to deformation • sleeve and pinducers from Ergotech • sensor layout adapted from W. Pettitt (ASC) &P. Young (Univ.Toronto)
Test sample • outcrop sandstone from quarry in the Vosges mountains, France • intact and perforated sample with a 5 mm horizontal borehole • porosity: 20% • uniaxial compressive strength: 48 MPa • horizontally layered • length: 12.7 cm • diameter: 5.08 cm • testing on dry sample
(vertical vP) (horizontal vP) (horizontal vS, parallel to bedding plane) (horizontal vS, normal to bedding plane) • Four stages of AEs: • no AEs before point A • slow linear increase (A to B) development of borehole breakouts • (global contracting behaviour of sample) • sharp increase (B to C) localisation of macroscopic shear bands (dilatancy of sample) • accelerated phase (after C) catastrophic failure
(vertical vP) (horizontal vP) (horizontal vS, parallel to bedding plane) (horizontal vS, normal to bedding plane) • Four stages of AEs: • no AEs before point A • slow linear increase (A to B) development of borehole breakouts • (global contracting behaviour of sample) • sharp increase (B to C) localisation of macroscopic shear bands (dilatancy of sample) • accelerated phase (after C) catastrophic failure
(vertical vP) (horizontal vP) (horizontal vS, parallel to bedding plane) (horizontal vS, normal to bedding plane) • Four stages of AEs: • no AEs before point A • slow linear increase (A to B) development of borehole breakouts • (global contracting behaviour of sample) • sharp increase (B to C) localisation of macroscopic shear bands (dilatancy of sample) • accelerated phase (after C) catastrophic failure
(vertical vP) (horizontal vP) (horizontal vS, parallel to bedding plane) (horizontal vS, normal to bedding plane) • Four stages of AEs: • no AEs before point A • slow linear increase (A to B) development of borehole breakouts • (global contracting behaviour of sample) • sharp increase (B to C)localisation of macroscopic shear bands (dilatancy of sample) • accelerated phase (after C) catastrophic failure
(vertical vP) (horizontal vP) (horizontal vS, parallel to bedding plane) (horizontal vS, normal to bedding plane) • Four stages of AEs: • no AEs before point A • slow linear increase (A to B) development of borehole breakouts • (global contracting behaviour of sample) • sharp increase (B to C) localisation of macroscopic shear bands (dilatancy of sample) • accelerated phase (after C) catastrophic failure
3D X-ray CT scan (post test) red: pore volume green: fractured volume
Data analysis: work steps • 2551 events classified as AE (detected on a minimum of 3 receivers) • 1072 events located recorded on 6 or more receivers: • grid search method • transverse isotropic velocity model • InSite software • correct amplitudes according to calibration • assume cosine sensitivity function accounting for receiver sensitivity varying with incidence angle • subset of 305 events with clear P-wave arrivals recorded on at least 10 receivers analysed by moment tensor analysis: • volume changes during triaxial laboratory experiments interpreted as volume expansion by tensile opening of fractures • P-wave first onset amplitudes • Green’s functions assuming a homogeneous velocity model • linear inversion performed in time domain • neglecting time-dependence of source-time function • resulting in 162 moment tensors fulfilling quality requirements
black triangles: pinducers red triangles: transducers (measuring velocities) left: coloured according to origin time right: coloured according to phase of experiment green: development of borehole breakouts blue: localisation of macroscopic shear bands red: catastrophic failure of the sample
Decomposition of moment tensors events close to borehole events located in the fracture wings • irregular distribution • events occurring close to borehole: higher fraction of isotropic percentage • events occurring in fracture wings: higher fraction of DC percentages
Hudson (t-k) plots Interpretation of t-k coordinates coloured according to seismic moment • majority of events situated in upper half (opening fractures) • events with small seismic moment: mechanism tensile • events with large seismic moment: mechanism close to pure shear
Hudson (t-k) plots coloured according to origin time events close to borehole events located in the fracture wings
Hudson (t-k) plots phase 4 phase 2 phase 3 coloured according to distance from borehole
Summary • majority of events indicates tendency of opening fractures • seismic moments increase with time • double couple percentages increase with time • isotropic percentages decrease with increasing seismic moment • events with small seismic moments are rather related to tensile mechanisms of explosive character, whereas events having a large seismic moment are related to more ”pure shear-type” mechanisms • events close to borehole show higher fraction of isotropic percentage compared to events in fracture wings (higher fraction of DC percentages)
source mechanisms coincide with orientation of fractures developing • strike of nodal line close to strike of borehole • fractures almost vertical => focal mechanisms: normal/reverse faulting • focal mechanisms in fracture wing A (closer to borehole): more scattered, most likely due to complicated stress conditions close to borehole • significant non-double couple components • positive values of ISO and CLVD: tensile fracturing • vp/vs ratios retrieved correspond to values measured
Challenges • records too noisy to automatically pick P-wave amplitudes • unknown amplification of sensors (due to unknown coupling) • changes in P- and S-wave velocity throughout experiment complicate interpretation of non-DC components • anisotropy may cause artificial ISO and CLVD percentages even for pure shear cracks (Vavryčuk, 2005) • difficult interpretation of moment tensors: correlation of mechanisms with time, seismic moment, location in sample is inconclusive • waveforms affected strongly by presence of horizontal borehole and probably specimen’s wall rendering moment tensor solutions computed employing P-wave first onset amplitudes and homogeneous velocity model potentially erroneous • outlook: full waveform inversion taking into account full geometry of sample will be applied using SEM to compute Green’s functions
event close to borehole event located in the fracture wings • no S-wave distinguishable due to proximity of source and receiver (in most cases) • complex waveforms • long coda waves due to interaction with surface of borehole/specimen’s walls
Spectral element method (Komatitsch and Tromp, 1999) strike-slip source with 900 kHz main frequency and ~4mm wavelength borehole walls: reflecting sample outer walls: absorbing CUBIT software for meshing of 194 710 hexahedral elements
Spectral element method (Komatitsch and Tromp, 1999) Direct P wave Direct S wave S-to-S reflected wave (borehole walls)
Conclusions • advanced laboratory equipment to measure acoustic emissions from stressed rock • initiation and coalescence of microcracks detected from AE around a small borehole • complex source mechanisms close to borehole, and shear/tensile opening along macroscopic failure plane • successfully shown that non-double couple events occurred during experiment • the larger the events the larger the DC component • SEM is a strong tool to compute waveforms in complex media and thus to improve understanding on potential sources of errors during full moment tensor inversion
Thankyou for your attention!