Download
1 / 28
280 likes | 432 Vues
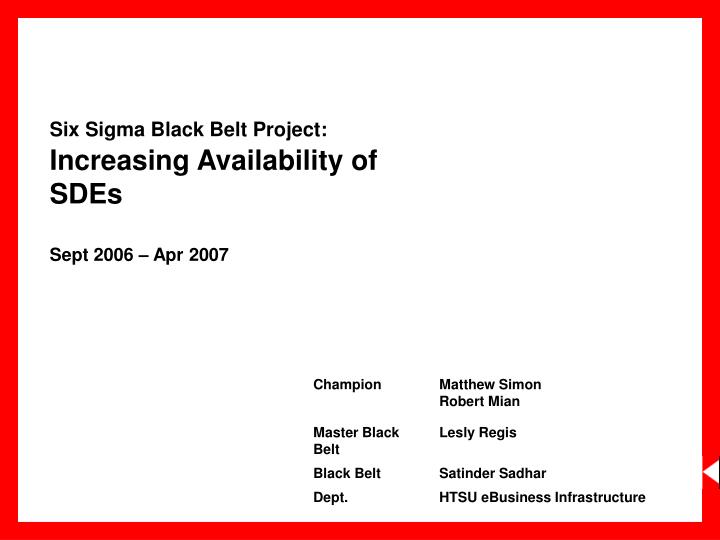
Six Sigma Black Belt Project: Increasing Availability of SDEs Sept 2006 – Apr 2007. Define - Develop team charter, identify key stakeholders and requirements. Define critical processes. D. M. A. E. C. DEFINE STORYBOARD : Increasing SDE (Strategic Development Environment) Availability.

E N D
Six Sigma Black Belt Project: Increasing Availability of SDEs Sept 2006 – Apr 2007
Define - Develop team charter, identify key stakeholders and requirements. Define critical processes. D M A E C DEFINE STORYBOARD : Increasing SDE (Strategic Development Environment) Availability • The Problem: • Business customers feedback of SDE is that they are too many problems and availability issues. • Takes too long to fix the issues. • There is a lose in development time. • Engineers are spending too much time investigating issues. • Business Case: • Delivering 120+ SDEs 2006 and will deliver a higher number in 2007. • SDEs are a crucial for the development teams. • If SDEs are not available it is potentially wasted time for developers and project timeline impacts. • Goals : • Reduce the downtime of SDEs to business users. • Reduce the amount the Incident Tickets in GSD that HTSU engineers investigate. • Improve customer perception. • Hurdle: • Resource availability of project team for this endeavor. • Working in resource in GLT/India to do data analysis of Incident Tickets. • Project Team: • Core team identified: 4members from Jersey City office and 1in India. • Extended team of 2 located in HK and UK. • Stakeholder analysis indicates all are supportive. • Metrics: • Number of Incident tickets. • Number of hrs. developers were impacted. Project Charter Approved High Level Process Map : Critical Processes defined in 3 steps; • Tollgate : • Meeting held with Champion. • We have identified resources. • We have their support. • We defined the project scope. • We need approval to more forward. GRANTED !
Measure – Map and Analyze the process, Collect data, determine process capability. D M A E C MEASURE STORYBOARD : Increasing SDE (Strategic Development Environment) Availability • Project Kick-off Meeting: • Held kick-off meeting with all attendees. • Completed analysis of the process. • Created a Data Collection Plan. • Critical outputs determined: • Downtime to Developers. • Number of Incident tickets. • Time impact to engineers. • Created an XY Matrix to determine which inputs possibly have the highest effect on the 3 outputs: • Application Server Issues. • Web Server Issues. • BMC Alerts. (additional in appendix) • Data Collection Plan Summary :How we got the data: • Data collected from Group GSD system and deployment team for one month. • Resource in GLT reviewed each ticket to categorize and calculate downtime. • What we measured: • Number of GSD Tickets related to SDEs. • System generated or opened via the Incident Management Team. • Which SDE the ticket was opened for. • Category the ticket falls into. Process Performance Defect Types: • The largest category of tickets are automated GSD tickets of ‘App Server Stopping’. Down Time to Developers: • The mean downtime to developers is 8.6 minutes and medium is zero minutes. Major Findings • 58% of tickets are assigned to HCOI-SS-PE-SW-ENGINEER-NONPROD queue. • 95% of the tickets are System generated. • The NA & CD region has the highest number of tickets. • Highest percentage of SDEs that raised incidents in October were delivered in Sept. 2006. • Tollgate: • Meeting held with Champion. • Update given on the data results. • Asked for approval to proceed to analyze the data more closely to determine the root cause. Granted!
Analyse – Identify Sources of Variation, Rank Key Causes of Variation & Validate Root Causes. D M A E C ANALYSE STORYBOARD : Increasing SDE (Strategic Development Environment) Availability By using the following analysis tools the factors impacting SDE Delivery Time were determined; From the Cause and Effect Diagram we determined root causes for our top 3 categories. App server Down. • SDEs missing v2.1 of Code Deployment release. • No action to stop BMC during change orders. • SSH keys incorrectly setup. Logwatch: Patrol Checker error. • Runs once an hour. • Error seen if deployment happens at same time alert runs. • Error seen if server goes down. Logwatch: Error Recorder error. • IDV software related. BMC Patrol not available • BMC Software bug. Brainstorming session held with project team. Identified the possible sources of variation (X’s) for the top categories of incidents. From the Pareto Chart we concluded: Top 3 categories for SDE Incident tickets are Appserver Down, Logwatch Error and BMC Patrol unavailable. The project team’s analysis has determined that the noted root causes should all be goals for improvement in this project. See appendix Implemented the following Quick Hits using our Special Cause Strategy tools: • Reviewed the BMC Monitoring for SDEs in all regions and had global agreement in updating the monitoring. With this action unneeded monitoring was eliminated. • Held a meeting with the System Engineer team to review the task of setting up SSH Keys. Corrective measures taken. • Held a meeting with the IDV Development team to understand reason for ErrorRecorder log monitoring. Determined that ErrorRecorder log does not need to be monitored via BMC. If development teams have an issue with IDV they should open an incident ticket. As a result the BMC team has removing monitoring and alerts for ErrorRecorder log. • Tollgate: • Meeting held with champion. • Update of our analysis and completed Quick Hits presented. • Asked for approval to move forward to generate solutions. Granted
Engineer – Generate Solution Ideas, Select Best Fit Solution, Test Solution and Confirm Results D M A E C ENGINEER STORYBOARD : Increasing SDE (Strategic Development Environment) Availability Estimated Benefits Costs Screened Solutions 1. Install BDE v2.1 + patches This will bring the SDEs to the latest patch level. V2.1 + patches have a fix to stop the BMC monitoring for a code deployment. This will reduce the number of ‘APPServer Down’ GSD tickets. These tickets are considered false alarms and with reduce the number of incidents engineers need to respond to. No incremental hard costs. 1. Improve BMC monitoring for ‘AppServer Down’ and ‘Logwatch errors’ For AppServer Down BMC will monitor every minute and report an incident if an error is present for 5 consecutive minutes. For Error Recorder Error we will remove the monitoring for all SDEs. It was agreed with the IDV Dev team. For Patrol Checker Error we will change the monitoring to every 30 minutes and report an incident if an error is present for 3 consecutive alerts. By updated the monitoring on BMC it will result in an improved alerting for SDEs. Unneeded alerts will be removed and duplicate alerts will be eliminated by increasing the rate of monitoring and alerting. Most importantly we will see a reduced number of incident tickets engineers need to respond to. By creating this script it will eliminate false alerts created by BMC and will reduce the number of false alarms that are responded to. The script needs to be created by the Central Infrastructure team. 3. Create a script to stop/start BMC A script needs to be created to turn BMC off before working on a Change Order. The script also needs to turn BMC on after the Change Order is complete. The script needs to be run by engineers. Less than 40 hrs of development time. • Summary of Total Results & Benefits • Pilots were implemented in Feb 2007. • ZERO Logwatch Patrol Checker and Error Recorder Error incidents reported in Feb and March. • App Server Down is still the highest category of incident tickets, however the number has reduced from previous months. • ‘BMCPatrol Unavailable’ is now 2nd highest. • Next Steps • Monitor results of pilot till April 2007. • Determine % of App Server tickets that have engineers responding to them. • Determine the usage of SDEs with the most ‘App Server Down’ tickets. • Revisit the monitoring of the App Server. • Tollgate • Updated Champion on the solutions implemented. • Held meeting with Champion to present pilot results. • Asked Champion for an additional month to monitor pilot results. • Champion agreed to continue with pilot and after results are presented will advise on next steps.
Engineer – Generate Solution Ideas, Select Best Fit Solution, Test Solution and Confirm Results D M A E C ENGINEER STORYBOARD : Increasing SDE (Strategic Development Environment) Availability • Update of Next Steps • Monitor results of pilot till April 2007. • Determine % of App Server tickets that have engineers responding to them. • Determine the usage of SDEs with the most ‘App Server Down’ tickets. • Revisit the monitoring of the App Server. • Results • April results indicate the solutions are in control. Zero LogWatch error tickets reported and 14 App Server Down tickets were responded to. • Engineers responded to 9% of App Server tickets, 14/150. • The usage of SDEs with the most ‘App Server Down’ tickets are owned by the HCOI Development community. In review with them they indicated they purposely leave the App Server down or restart numerous times. • The App Server down tickets will have further reductions when Screened Solution #3 is implemented. • Summary of Total Results & Benefits • ZERO Logwatch Patrol Checker and Error Recorder Error incidents reported in April. • App Server Down is still one of the highest categories of incident tickets, however engineers are responding to less then 10% of the issues with improvements in monitoring. • Engineers spent 46 minutes in April responding to non-development SDEs with App Server down tkts. • Tollgate • Updated Champion that pilot results are being sustained. • Champion has given signoff to move to Control Phase. Granted!
Control – Implement Solution, Monitor Process & Results, Replicate & Share Best Practices. D M A E C CONTROL STORYBOARD : Increasing SDE (Strategic Development Environment) Availability PRATO PLOT -- “Top Categories” OCTOBER 2006 APRIL 2007 IMPROVEMENT RESULTS BUSINESS CASEBusiness users have indicated in feedback there are availability issues with SDEs (Software Development Environments); there are too many problems and they take too long to fix. In October 2006 engineers have spent 71 hours investigating incidents costing $6345. • RESULTS • Engineered and implemented solutions for the top 3 incident categories. • Reduced investigation time for top 3 categories by 97%. • Eliminated ‘Logwatch’ Error incidents. • One year projected savings of $33K. • BMC Monitoring was improved to eliminate the ‘false alarms’. LESSONS LEARNED In the Define Phase it was thought that savings would be over $100,000. In the Analyse phase it was discovered that a large portion of the incident tickets were not being investigated by engineers, the incidents were auto closing. For the incidents being investigated in the top 3 categories, most were false alarms and on average have 5-10 minutes of investigation time. To Be Reviewed by HBUS Finance PROJECT BENEFITS • TOLLGATE • Project results presented to Champion. • Explained why the cost gavings was lower then expected. • Explained the other benefits gained from the project.
DEFINE: Stakeholder Analysis Page #1
Page #2 DEFINE: Charter Title: Increasing Availability of SDEs for Business Use Prepared by: Satinder SadharChampion: Matt Simon/Rob Mian Key Stakeholders: Matthew Simon, Rich Boyer, William McCloskey, Sarah Carroll PROBLEM STATEMENT: BUSINESS CASE: HTSU organization is committed to delivering at the very least 120 SDEs in 2006 and a higher number in 2007. As the number of SDEs increase, the number of global business teams using the SDEs will also increase. The SDEs are a crucial part of their development projects and having them available for use is a must. Every time an SDE is unavailable for use it is potentially wasting development time and impacting project schedules. Improving the availability of the SDEs will help the global business teams, reduce problems and improve perception. Business users have indicated in feedback that there are availability issues with SDEs (Software Development Environments) because there are too many problems and they take too long to fix. Currently SDEs are unavailable for use XX to XX hours a month and costing $XXX of lost development time. GOAL STATEMENT: • Reduce the number of lost development time by XX% before the end of the year. • Reduce the top category of issues that engineers investigate. PROBLEM MILESTONES: PROJECT SCOPE AND BACKGROUND: Jul 06 Champion approval of project charter Aug 06 Kickoff meeting Aug 06 Define Tollgate Oct 06 Measure Tollgate Dec 06 Analysis Tollgate Feb 07 Engineer Tollgate Apr 07 Control Tollgate Metrics: Primary: Number of SDE incident tickets. Secondary: Number of hrs. developers were impacted. Scope: IN: After an SDE is delivered to a customer for BAU use. Team Selected: Black Belt Satinder Sadhar 40% HTSU Eng. representatives James Golden 5% GLT Resources Resource to analyze data 100% HCOI Monitoring Team Lou Benetis 5% HCOI Development Chun Huang 5%
DEFINE: Block Diagram and SIPOC Page #3 • Regional ITO PMs • ITDMs • Global Dev Teams • HCOI ESM/BMC • HTSU eBiz Engineers • HCOI IMT • Auto-generated GSD Incident Ticket • BMC Alert • Manually generated GSD Incident ticket • SDE # • Host Name • Region • Type of issue • closed GSD tkt. • functional SDE. • Entity PMs • Regional ITO PMs • ITDMs • Global Dev Teams • HCOI IMT START END Incident Reported Engineer Investigates Incident Resolved
Page #4 • In October 2006, there were 572 tickets related to SDEs. • 541 of the 572 (95%) tickets were System Generated. Measure Data Analysis – Tickets
Page #5 • 46% (248/541) of the System Generated tickets were related to the Application server stopping. • 60% (329/541) of the tickets were opened in the PW-SW-ENGINEERING-NONPROD queue. Measure Data Analysis – System Generated Tickets
Page #5 • The Average Down time to developers for the System Generated tickets is approximately 9.8 minutes and the median is 0 minutes. Measure Data Analysis– System Generated Tickets
Page #6 • The SDEs with the highest system generated tickets were NA006 (88) followed by CD032 (36) and EU025 (32). • The highest percentage of SDEs were delivered at the end of September 2006. Measure Data Analysis – System Generated Tickets
Page #7 • The incident tickets fell into a wide range of categories, however 20% of the incidents were related to Code Deployment failures. Each time the deployment failed due to a different reason. Measure Data Analysis – Manually Generated Tickets
Page #8 • The AP Region opened the highest number of Manual Incidents Tickets. The incidents were spread across different SDEs however many of the issues were related to Code Deployment. Measure Data Analysis – Manually Generated Tickets
Page #9 • For System generated tickets we need to investigate the root cause of the ‘APPServer’ and ‘LogWatch Error’ incident tickets as they show to be the vital issues. These categories were also the highest last month. • For the Manually generated tickets the root cause of Code Deployment failures needs to be investigated. This is the trend from last month. • Present to Project Champion and seem approval to move ahead. Measure Data Analysis – Next Steps
Measure XY Matrix Page #10
Measure XY Matrix Page #11
Page #13 Engineer: Improvement Solution Matrix
Page #14 Control: Benefits Certificate 1 of 2
Page #15 Control: Benefits Certificate 2 of 2