Download

1 / 19
190 likes | 294 Vues
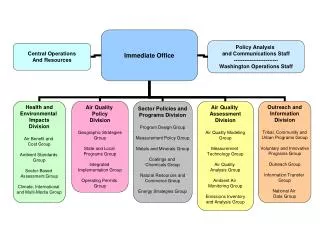
Precursor Gas Monitoring NO y Monitoring Training Overview. Kevin A Cavender EPA-Office of Air Quality, Planning and Standards. Outline. Methodology Interferences and operational issues Commercially available NOy Monitors Calibration Current work in progress Summary. Methodology.

E N D
Precursor Gas Monitoring NOy Monitoring Training Overview Kevin A CavenderEPA-Office of Air Quality, Planning and Standards
Outline • Methodology • Interferences and operational issues • Commercially available NOy Monitors • Calibration • Current work in progress • Summary
Methodology What is NOy? NOy consists of the sum of all reactive nitrogen oxides. including NO, and NO2, and other nitrogen oxides referred to as NOz. NO + NO2 + NOz = NOy The major components of NOz include nitrous acids [nitric acid (HNO3), and nitrous acid (HONO)], organic nitrates [peroxyl acetyl nitrate (PAN), methyl peroxyl acetyl nitrate (MPAN), and peroxyl propionyl nitrate, (PPN)], and particulate nitrates.
Methodology • Why Measure NOy? • NOy is a precursor to both ozone and PM2.5 formation • Conventional NOx boxes “accidentally” measure some NOz species, but not all.
Methodology Measurement Principles NO is measured based on its chemiluminescent reaction with O3 NO + 03 -> NO2 + hv The amount of light generated is linearly proportional to the concentration of NO. NOy is measured by first passing the sample through a converter that converts NO2 and NOz species to NO and then measuring for NO as above.
Methodology Diagram of a High Sensitivity NOy instrument
Methodology • What makes a high sensitivity NOy monitor different than a conventional (low sensitivity) NOx monitor? • A high sensitivity NOy monitor is very similar to conventional NOx monitors with the following exceptions: • Remote converter is located at sample inlet, not inside monitor • Pre-reactor to reduce non-NOy interferences • Increased sample flow rate • Reduced reaction chamber temperature and pressure
InstallationRemote Converter Remote Converter on 10 meter tower
Interferences and Operational Issues • Reaction of NO with ambient O3 • Ambient ozone will react with NO in sample lines creating negative NO interference • Residence in sample line should be kept to less than 2 seconds • Ammonia • Converter may convert a small amount of ammonia to NO creating positive NO interference • Avoid locating near ammonia sources (e.g., feed lots) • Converter height above ground level and “fetch”
Commercially Available NOy Monitors TAPI 200EU/501 NOy TEI 42CY EC9841A-NOy
Histogram of NOy Data Collected at Burden's Creek Site5/1/05-1/29/06 NO NOy NO2 + NOz Percent 0 0-1 1-5 5-10 10-50 50-100 100-200 200+ Concentration (ppb)
Histogram of NOy Data Collected at Burden's Creek Site5/1/05-1/29/06
Instrument OperationInitial Calibration • Note: Supply sufficient calibration gas to ensure excess flow through converter inlet (supply > 5 liters per minute) • Supply zero air until stable readings are obtained (approximately 20-30 minutes) • Adjust monitor to read zero response for NO and NOy. • Supply NO calibration gas at approximately 90% of scale • Adjust monitor after stable NO and NOy readings are obtained • Add ozone to calibration gas to produce NO2 at approximately 70% of scale • Amount NO decreases equals the amount of NO2 created • Calculate conversion efficiency as (NOy-NO)/(NO2 created) • Conversion efficiency should be greater > 96%. • Adjust NO2 + NOz reading to amount of NO2 created
Instrument OperationConverter Efficiency Test • Converter efficiency test designed to challenge converter with more difficult to convert NOy species • N-propyl nitrate, isopropyl nitrate • Supply sufficient calibration gas to ensure excess flow at converter inlet (> 5 liters per minute) • Supply calibration gas at approximately 90% of scale • Allow sufficient time for readings to stabilize • Calculate converter efficiency as – • (NOy reading/Concentration Suppliedx100%) • If converter efficiency is less than 96% the converter should be repaired/replaced
Current Work In Progress • Evaluation of inlet materials for API • Testing HNO3 loss on stainless steel, silico steel, and FTP teflon. • Evaluation of “proof of concept” NO/true NO2/NOy monitor • Two converters • Moly for NOy • High intensity LED for NO2