Download
1 / 39
390 likes | 525 Vues
Quality Accounts. Outline. Why Quality Accounts Structure of Quality Accounts Aquifers Rivers How to define quality classes? Several country examples Issues Aggregation Measurement. Why quality accounts?.

E N D
Outline • Why Quality Accounts • Structure of Quality Accounts • Aquifers • Rivers • How to define quality classes? • Several country examples • Issues • Aggregation • Measurement
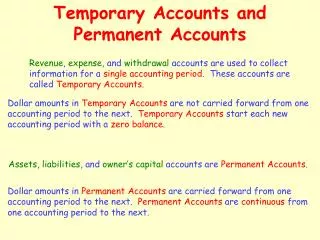
Why quality accounts? • Quality accounts describe the quality of water resources at the beginning and end of the accounting period in terms of chemical, physical and biological characteristics • Important because • Quality limits water availability for certain purposes • It is a first step towards ecosystem accounting and its variants BUT • Still experimental (few country experiences; little or no standardization) • Link with pressures due to human activities is not direct
Quality of what? • Quality of water bodies, NOT waterbeds / riparian zone • Water body : “mass of water distinct from other masses of water” • Examples: rivers, lakes, aquifers …
Structure of quality accounts Source: SEEAW
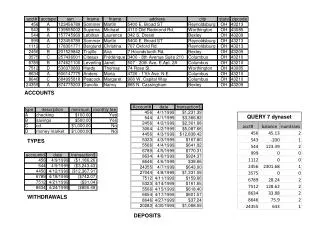
Aquifers: Australia Groundwater quality in Victorian provinces (in million m3) • Based on sustainable yield as a proxy, NOT volume of storage Source: Water Account for Australia – 1993-94 to 1996-97 - Australian Bureau of Statistics, May 2000.
Quality class State A State B Change State A 12.5% 0.0% -13% 18.8% 50.0% +31% 56.2% 37.5% -19% 13.5% 13.5% +0% State B 100% 100% 0 Rivers: from point to monitoring Are these statistics relevant?
Rivers • Monitoring of points & generalisation to water systems • Particular difficulty with water courses: how to account for their relative size? • Runoff is measured at the lowest point of a basin – the quality varies along the stream • The mere length confuses large rivers and small streams • Statistics of points make sense only when the monitoring system is dense – rarely the case
River group Small Medium Large ˆ Quality … † ‡ Class1 Class2 ƒ Class3 „ ‚ Stretches / Reaches Reach or stretch: a portion of a stream or river, as from one turn to another, supposedly having constant characteristics any distance between 2 monitoring points
Accounting unit: SRU (1) • River reaches as basic accounting units for rivers • Importance is best measured by length and discharge • Best candidate is SRU (standard river unit) = reach length discharge in m3 s-1 • Large and small rivers can be aggregated when measured in SRUs • Can be classified or weighted with quality indexes • Results comparables from basin to basin • Robust and easy to compute
Accounting Unit: SRU (2) Flow Length Li = a SRU Qi X Large river = b SRU X Lj Qj Slow, medium X = c SRU Qk Lk Fast, small
Summary For compiling quality accounts we need: • SRU value for each river reach for all rivers • We need to assign a quality for each reach for all rivers
Accounting Unit: SRU (2) Flow Length Li = 4 SRU Q1 Qi X Large river = 0.5 SRU Q2 X Lj Qj Slow, medium X = 1.5 SRU Q2 Qk Lk Fast, small
Structure of quality accounts Source: SEEAW
Ways of assessing water quality • According to disturbances/perturbations to functions • Total hydraulic and osmotic power of river basins • Health of ecosystem approach (resilience)
Defining quality classes • Normative values for “determinands” (parameters) • Physical: temperature, colour • Chemical: pH, NH4+ … • Biological: bacteria, flora, fish … • Etc.. • Allowable deviations from reference conditions • European Water Framework Directive
Example: Malaysia (1) WQI = 0.22*SI DO + 0.19*SI BOD + 0.16*SI COD + 0.15*SI AN + 0.16*SI SS + 0.12*SI pH where SI is the subindex of each parameter.DO - Dissolved OxygenBOD - Biological Oxygen DemandCOD - Chemical Oxygen DemandAN - Ammoniacal NitrogenSS - Suspended SolidpH - Acidity/Alkalinity
Example: France (1) • SEQ-eau • Use-oriented Recognizes: drinking water, leisure, irrigation, livestock watering, aquaculture aquatic life • Based on 15 suitability indicators • Computed from 135 determinants • Matrices: • determinants X indicators (computed from) • uses X indicators (significant for) • determinants X classes (threshold values) Source: Presentation User-Producer Conference by R. Lalement
Example: France (4) • Results in • a class of suitability for each use • an index (and class) for overall quality • For each indicator, the worst determinant wins • For each use, the worst indicator wins • For each determinant, apply the percentile 90 rule to multiple samples (not the average) [this is called “Rule of the worst”] • ... an in depth assessment for uses, • but little ecology : independent of « ecotype »
France: Monitoring Costs (5) • The estimated cost of the surveillance monitoring programme is • 77 M€ for rivers and • 8M€ for lakes • for a management plan, or • 50 k€ for rivers • 40 k€ for lakes • per site for a management plan, or • 150 €/km2 (rivers and lakes), or • 150 €/km (rivers).
Example: Canada S = scope, number of failed determinands/total F = frequency, number of failed tests/total E = excursion, target value/observed value
Results: French Quality Accounts Example:France 1992-1994 Results: organic matter indicator in SRU*1000
ISSUES • Choice of determinands • Classification of uses • Assessment: Rule of worst • Temporal issues • Aggregation over space (indicators) • Link with economic sphere
Choice of determinands • Country and context dependent • Based on functions or uses
Classification of uses • No standardized classification of uses or functions • Different uses for different type of water bodies? (case of France) • Different uses per water body? (USA) • How to deal with multiple use? • Choose the most stringent use? (AUS)
Assessment : Rule of the worst • “One out, all out” • Reason: assure equal weight to all parameters • Applicable at level of determinands, indicators or uses • Problem: • Extreme values; seasonal variations • Improvement of monitoring leads to increased probability of finding bad status
Aggregation: space (1) • Which rivers to include? • Scale determines outcome • River basin • Weighted average indicator • Hotspots • Pattern index
Aggregation: space (2) • River Quality Global Index (RQGI) • Aggregates over river basin • Weighted average of SRU according to quality class • Scale 0-10 • n is number of classes
Aggregation: space (3) • Pattern index • Measures the variability in space in quality of the River Basin • Able to distinguish “hotspots”
Temporal issues • How to reflect seasonal variations in the quality accounts? • What to do with inter-annual variations (wet years..) • Actual SRU or averages? • How to deal with sudden events • Frequency of monitoring SEEAW advocates compilation of Quarterly Accounts
Link with economic sphere (1) • Water quality accounts • Ideal is to measure efficiency of water quality management programmes at basin level • BUT: changes in water quality can have different causes Water quality t1 = f(Water quality t0, ∆(uncontrolled events), ∆(abstractions), ∆(emissions), ∆(expenditure)) • f() = unknown • Therefore…….
Questions • Data availability? • Frequency? • Distribution of monitoring stations? • Are flows and quality measured simultaneously? • Which determinands are measured? • Economic data per river basin? • Are different uses distinguished? • Experience in compilation?