Download
1 / 29
290 likes | 488 Vues
THE METRO AREA IMPACT OF HOME BUILDING IN BRYAN & COLLEGE STATION, TX. Presented by : Elliot F. Eisenberg, Ph.D . October 26, 2010 College Station, TX. LOCAL ECONOMIC IMPACT. Construction phase Jobs Materials Local fees, taxes, contributions Ripple or feed-back from construction

E N D
THE METRO AREA IMPACT OF HOME BUILDING IN BRYAN & COLLEGE STATION, TX Presented by: Elliot F. Eisenberg, Ph.D. October 26, 2010 College Station, TX
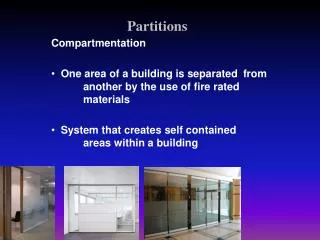
LOCAL ECONOMIC IMPACT • Construction phase • Jobs • Materials • Local fees, taxes, contributions • Ripple or feed-back from construction • Wages spent in local economy • Occupancy phase • Earnings spent in local economy
The model does not say build housing to stimulate the local economy • Rather, it is job creation that results in increased demand for housing, but remember that….. HOUSING è JOBS
CONSTRUCTION PHASE VALUE OF CONSTRUCTION SERVICES PROVIDED AT CLOSING PERMIT/HOOK-UP FEES $ $ $ $ $ (Obtained from Local Sources) INPUTS: MODEL OF THE LOCAL ECONOMY INCOME FOR LOCAL RESIDENTS & TAX/FEE REVENUE FOR LOCAL GOVERNMENTS OUTPUTS:
RIPPLE PHASE LOCAL INCOME & TAXES FROM PHASE 1 INPUTS: SPENDING ON LOCAL GOODS & SERVICES Consumer Expenditure Survey (U.S. Bureau of Labor Statistics) MODEL OF THE LOCAL ECONOMY OUTPUTS: LOCAL INCOME & TAXES
OCCUPANCY PHASE INCOME OF HOUSEHOLD OCCUPYING NEW HOUSING UNIT INPUTS: SPENDING ON LOCAL GOODS & SERVICES PROPERTY TAX PAYMENTS MODEL OF THE LOCAL ECONOMY OUTPUTS: LOCAL INCOME & TAXES
The Bryan-College Station, TX MSA Multiplier Only Captures Spending that Stays in the Area Includes: Banking, Car Repair, Dry Cleaning, Day Care Services, Dental Services, Electricity, Landscaping, Legal Services, Manicures, Medical Services, Newspaper Delivery, Restaurants and Psychiatric Care. But Not: Auto Manufacturing, Beer Bottling, Mattress Manufacturing, Meat Packing, Movie Production, and Travel Agency Services
History of the Model • Over 650 Economic Impact Analyses Performed • Users of the Model Include: • Boone County Kentucky • Habitat for Humanity, International • MI State Housing Development Authority • Michigan State University • Missouri Housing Development Commission • University of Florida • University of Massachusetts • University of Montana • West Virginia Housing Development Fund…
Assumptions of the Model Inputs To ModelSingle Family Average house price: $263,201 Average raw lot cost: $26,171 Permits/Infrastructure: $5,071 Annual property taxes: $5,508
Economic Impact of Single Family Home Building • 1st - Construction phase • 2nd - Ripple effect from construction phase • 3rd - Occupancy phase • 4th - Ten year total
FIRST YEAR IMPACT: SF Construction Every 952 SF Homes INCLUDING: 1,680 Jobs in Construction 361 Jobs in Wholesale & Retail Trade 210 Jobs in Business and Professional Services
FIRST YEAR IMPACT: SF Ripple INCLUDING: 266 Jobs in Wholesale and Retail Trade 253 Jobs in Local Government 140 Jobs in Health, Education & Social Services
ONGOING SF ANNUAL EFFECT INCLUDING: 184 Jobs in Wholesale and Retail Trade 170 Jobs in Local Government 94 Jobs in Health, Education & Social Services
Total SF Impact: First Ten Years Along with 3,622 temporary jobs And 839 permanent ones!
Largest Local Employers Employer# of FT Jobs Texas A&M University System 16,000 New SF Residential Construction 2,390 St. Joseph Regional Hospital 2,197 Bryan Independent School District 2,070 Sanderson Farms 1,574 College Station Independent School District 1,530 Reynolds & Reynolds 1,059 City of College Station 1,027 Brazos County 900 Wal-Mart Stores, Inc. 850 City of Bryan 789 Alenco Windows 611 H.E.B. Grocery 590
BUT NEW HOMES REQUIRE: INFRASTRUCTURE • Fire and police protection • Garbage collection • Parks and recreational opportunities • Roads • Correctional facilities • Primary and secondary education • Etc…
Now that we know: The benefits of construction & The costs of construction Does new construction pay for itself?
Yes it does! For every 952 SF units-- • By the 2nd year economic impacts offset fiscal costs • By the end of the 2nd year the debt is fully paid off • In the 2nd year, net is $5,441,455 and is $5,680,775 thereafter
Over 15 years, every 952 SF units generate a cumulative $178.9 million in revenue for local governments—but only $105.3 million in costs
New Assumptions of the Model Inputs To ModelSingle Family Average house price: (was $263,201) $197,401 Average raw lot cost: $26,171 Permits/Infrastructure: $5,071 Annual property taxes: $4,131
Yes it still does! For every 952 SF units-- • By the 2nd year economic impacts offset fiscal costs • By the end of the 2nd year the debt is fully paid off • In the 2nd year, net is $5,441,455 and is $5,680,775 thereafter
What does 2 years mean? • That is, should it be done faster, or is it O.K.? • Big purchases take time to pay off. • Car loans now last 5 years, and many lease! • How fast did you pay off your student loans? • How fast are your kids paying off theirs? • Did you pay off your home in 2 years?
How Large Are Non Property Tax Revenues • Single family property taxes are $5,508/unit per year but, yearly revenue is $11,624/unit per year, which is 111% more. • Clearly, property taxes are not the whole story!
A Closer Look at Primary and Secondary Education • 12.6% attend private schools nationally • 1.7% are Home schooled nationally • 0.4 school age children/MF unit nationally • 0.6 school age children/SF unit nationally • TX school aid is $92 million or 51% of budget
ANY QUESTIONS? • Elliot F. Eisenberg, Ph.D. • Call: 202.266.8398 • Fax: 202.266.8426 • eeisenberg@nahb.com • 1201 15th Street NW • Washington, DC 20005-2800 • Thank you very much!