Download
1 / 18
180 likes | 291 Vues
Real food scenarios. Inter- and Extrapolation Predicting microbial response to food environment based on data generated on laboratory media. Interpolation in multidimension. Interpolation. Extrapolation. Strict interpolation region. NaCl (%). Temperature ( o C). pH.

E N D
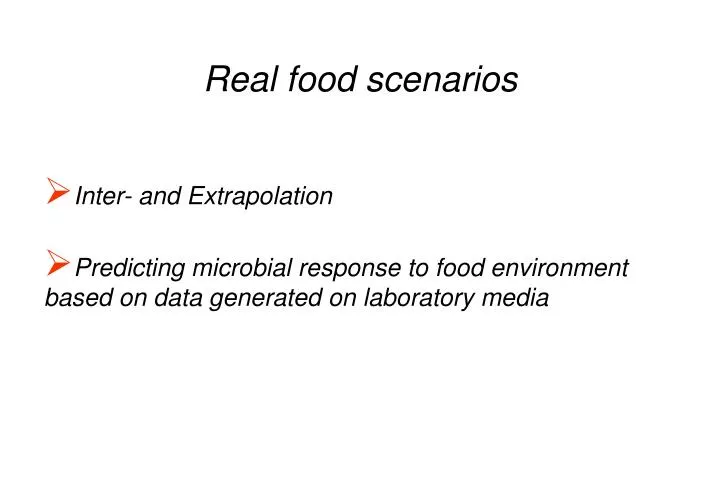
Real food scenarios • Inter- and Extrapolation • Predicting microbial response to food environment based on data generated on laboratory media
Interpolation in multidimension Interpolation Extrapolation
Strict interpolation region NaCl (%) Temperature (oC) pH The 2D interpolation region (Temp, pH) becomes smaller as salt concentration increases.
NG U G M Minimum Convex Polyhedrons M G U M: Experimental conditions used to create the Model for growth RATE G: Experimental conditions not used to fit the growth model but at which Growth was observed U: Conditions at which the response is Unknown NG: Conditions at which No Growth was the observed result
Predicting microbial responses to food environments based on data generated on laboratory media
Observations in food vs. predictionsfrom model based on broth Predicted and independently observed log-doubling times for Brochothrix thermosphacta. Broken line: safe prediction, above which there should not be more than 5% of the points.
Components of the error when modelling the specific growth rate Model in broth Error of food predictions= Bias2 + variance in food B B Ln (m) B F B F B F F Error of food predictions= variance in food F Temperature
Maximum specific growth rates observed in fresh meat vs model predictions Error: 46.3% From which Bias: +39.0% Error: 20% Bias: 0% (estimation of variability in food)
Assuming that the bias of the prediction is ca. constant: Ln μpred – Ln μobs ≈ 0.39 (average bias) corrector: c =exp(0.39) = 1.47 (the smaller is h, the moreexp(h) ≈ 1+ h can be used for paractical purposes!) Correct the prediction with the bias factor: μobs ≈ μpred / c Broth-data-based predictive models of specific growth rate overestimate the rates in food scenario, where the variability is bigger
A simple case study Worry: Listeria monocytogenes in soft cheese Currently the “Use by” date is 8 days after purchase, assuming 4oC storage temperature. Question 1 The temperature happens to be in fact 7oC. How should the “Use by” date change without compromising safety?
Listeria monocytogenes in soft cheese By what factor should we decrease the storage time in order to compensate for the higher storage temperature?
To generate predictions, use the Modelling Toolbox menu point
Listeria monocytogenesat low temperatures 3 oC increase in storage temperature halves the storage time if the safety level is to be kept unchanged.NB: No claim has been made that Listeria grows at 4 oC. Correct interpretation: if the temperature changes, then the “Use by” date should change according to the above rule for keeping the microbiological safety of the food against Listeria unchanged.
Question 2 Which environmental effect is the “most important” ? Wrong question. Correct formulation: A change in one environmental factor is equivalent to what change in another one ?
Listeria monocytogenesat low temperatures 3 oC increase in storage temperature halves the storage time if the safety level is to be kept unchanged.What change in NaCl is needed to have equivalent effect to 3oC increase of the temperature?
Listeria monocytogenesat low temperatures 3 oC increase in storage temperature is equivalent to 6.5 % added NaCl !