Download
1 / 57
600 likes | 698 Vues
Linear Equations and Functions. Algebra 2 Chapter 2. This Slideshow was developed to accompany the textbook Larson Algebra 2 By Larson , R., Boswell, L., Kanold , T. D., & Stiff, L. 2011 Holt McDougal Some examples and diagrams are taken from the textbook. Slides created by

E N D
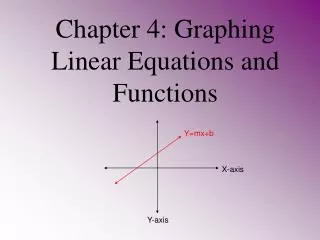
Linear Equations and Functions Algebra 2 Chapter 2
This Slideshow was developed to accompany the textbook • Larson Algebra 2 • By Larson, R., Boswell, L., Kanold, T. D., & Stiff, L. • 2011 Holt McDougal • Some examples and diagrams are taken from the textbook. • Slides created by • Richard Wright, Andrews Academy rwright@andrews.edu
2.1 Represent Relations and Functions • Relation is mapping (pairing) of input values to output values • Input Domain often x • Output Range often y (-4, 3) (-2, 1) (0, 3) (1, -2) (-2, 4)
2.1 Represent Relations and Functions • Function • Relation where each input has exactly one output • Same x does not go to more than one y • Tell whether the relation is a function.
2.1 Represent Relations and Functions • Vertical line test • The relation is a function if no vertical line touches the graph at more than one point • Is it a function?
2.1 Represent Relations and Functions • Equation in two variables • Input usually x independent variable • Output usually y dependent variable • Solution ordered pair (x, y) that gives a true statement • To graph • Make a table of values by choosing x and calculating y • Plot enough points to see the pattern • Connect the points with a line or curve
2.1 Represent Relations and Functions • Linear function • Can be written in form y = mx + b • Graphs a line • y = 2x – 3 • Functional notation • Replace the y with f(x) • Name • Variable value
2.1 Represent Relations and Functions • Graph the equationy = 3x – 2
2.1 Represent Relations and Functions • Tell whether the function is linear. Then evaluate the function when x = –2. • f(x) = x – 1 – x3 • g(x) = –4 – 2x • 76 #3-39 odd, 43, 47 + 4 choice = 25
Homework Quiz • 2.1 Homework Quiz
2.2 Find Slope and Rate of Change (x2, y2) rise run (x1, y1) Slope is the rate of change
2.2 Find Slope and Rate of Change • Positive Slope • Rises • Zero Slope • Horizontal • Negative Slope • Falls • No Slope (Undefined) • Vertical 0 – + No There’s No Slope to stand on.
2.2 Find Slope and Rate of Change • Find the slope of the line passing through the given points. Classify as rises, falls, horizontal, or vertical. • (0, 3), (4, 8) • (7, 3), (–1, 7) • (7, 1), (7, -1)
2.2 Find Slope and Rate of Change • Parallel Lines • In the same plane and do not intersect • Go the same direction • Slopes are the same • Perpendicular Lines • Intersect to form a right angle • Slopes are negative reciprocals • OR Product of slopes is -1 • and
2.2 Find Slope and Rate of Change • Tell whether the lines are parallel, perpendicular, or neither. • Line 1: through (–2, 8) and (2, –4) • Line 2: through (–5, 1) and (–2, 2) • Line 1: through (–4, –2) and (1, 7) • Line 2: through (–1, –4) and (3, 5)
2.2 Find Slope and Rate of Change • In 1983, 87% of New Hampshire was forested. By 2001, that percent had fallen to 81.1%. What is the average rate of change of forested land? Then predict what percentage will be forested in 2005. • 86 #3-23 every other odd, 25-35 odd, 39, 43, 47 + 5 choice = 20
Homework Quiz • 2.2 Homework Quiz
2.3 Graph Equations of Lines • Slope-intercept form • y = mx + b • m is slope • b is y-intercept • To graph • Solve equation for y • Plot the y-intercept • From there move up and over the slope to find another couple of points • Draw a line neatly through the points
2.3 Graph Equations of Lines • Graph • y = -2x • y = x – 3 • f(x) = 2 – x
2.3 Graph Equations of Lines • Standard Form • Ax + By = C • A, B, and C are integers • To graph • Find the x- and y-intercepts by letting the other variable = 0 • Plot the two points • Draw a line through the two points x-intercept: Ax + B(0) = C Ax = C Y-intercept: A(0) + By = C By = C
2.3 Graph Equations of Lines • Horizontal Lines • y = c • Vertical Lines • x = c
2.3 Graph Equations of Lines • Graph • 2x + 5y = 10 • x = 1 • y = -4
2.3 Graph Equations of Lines • 93 #1-69 every other odd + 2 choice = 20
Homework Quiz • 2.3 Homework Quiz
2.4 Write Equations of Lines • Given slope and y-intercept • Use slope-intercept form y = mx + b • Any other line • Find the slope (m) • Find a point the line goes through (x1, y1) • Use point-slope form y – y1 = m(x – x1)
2.4 Write Equations of Lines • Write the equation of the line given… • m = –2 , b = –4 • it passes through (–1, 6) and has a slope of 4.
2.4 Write Equations of Lines • Write the equation of the line given… • it passes through (-1, 2) and (10, 0) • Write an equation of the line that passes through (4, –2) and is (a) parallel to, and (b) perpendicular to, the line y = 3x – 1.
2.4 Write Equations of Lines • A certain farmer can harvest 44000 bushels of crops in a season. Corn averages 155 bushels per acre and soybeans average 44 bushels per acre in Michigan in 2013. Write an equation that models the this situation.
2.4 Write Equations of Lines • In a chemistry experiment, you record the temperature to be -5 °F one minute after you begin. Six minutes after you begin the temperature is 20 °F. Write a linear equation to model this. • 101 #1-57 every other odd + 5 choice = 20
Homework Quiz • 2.4 Homework Quiz
2.5 Model Direct Variation • Direct Variation • y = ax can be used to model the situation • a = constant of variation (slope) • Write and graph a direct variation equation that has the given ordered pair as a solution. • (6, -2)
2.5 Model Direct Variation • Hooke’s Law states that the distance d a spring stretches varies directly with the force f that is applied to it. • Suppose a spring stretches 15 in. when a force of 9 lbs. is applied. Write an equation to relate d to f. • Predict the distance that the spring will stretch when a force of 6 lbs. is applied.
2.5 Model Direct Variation • The dimensions of five rectangles, each with an area of 24 ft2 are given in the table. Tell whether the length and width show direct variation. If so, write an equation that relates the quantities. • 109 #3, 7-15 odd, 19-31 odd, 35, 39, 43 + 4 choice = 20
Homework Quiz • 2.5 Homework Quiz
2.6 Draw Scatter Plots and Best-Fitting Lines • Scatter Plot • Graph of many data points • Positive Correlation • The slope of the scatter plot tends to be positive • Negative Correlation • The slope of the scatter plot tends to be negative • No Correlation • There is no obvious pattern from the scatter plot
2.6 Draw Scatter Plots and Best-Fitting Lines • Correlation Coefficient (r) • Number between -1 and 1 that measures how well the data fits a line. • Positive for positive correlation, negative for negative • r = 0 means there is no correlation
2.6 Draw Scatter Plots and Best-Fitting Lines • For each scatter plot, (a) tell whether the data have a positive correlation, a negative correlation, or approximately no correlation, and (b) tell whether the correlation coefficient is closest to –1, – 0.5, 0, 0.5, or 1.
2.6 Draw Scatter Plots and Best-Fitting Lines • Best-fitting line • Line that most closely approximates the data • Find the best-fitting line • Draw a scatter plot of the data • Sketch the line that appears to follow the data the closest • There should be about as many points below the line as above • Choose two points on the line and find the equation of the line • These do not have to be original data points
2.6 Draw Scatter Plots and Best-Fitting Lines • Monarch Butterflies: The table shows the area in Mexico used by Monarch Butterflies to spend winter, y, in acres x years after 2006. • Approximate the best-fitting line for the data. • Use your equation from part (a) to predict the area used by the butterflies in 2016.
2.6 Draw Scatter Plots and Best-Fitting Lines • 117 #1-29 odd + 5 choice = 20
Homework Quiz • 2.6 Homework Quiz
2.7 Use Absolute Value Functions and Transformations • Absolute Value Function • f(x) = a |x - h| + k • Simplest y = |x| Slope of left is -1 Vertex Slope of right is 1
2.7 Use Absolute Value Functions and Transformations • f(x) = a |x - h| + k • Transformations (changes to graph’s size, shape, position, or orientation) • Stretch/Shrink • a is the factor the graph is stretched or shrunk vertically • Multiply the y-coordinates by a • Since the slope of the right side of the graph was 1, the new slope will be a • Reflection Flips the graph over a line • If a is negative, the graph will be flipped over the x-axis • Translation moves graph • h is how far graph moves to right • k is how far graph moves up • Since the vertex was (0, 0), the new vertex will be (h, k) • Apply stretch/shrinks and reflections before translations • Multiply before adding Absolute value function only
2.7 Use Absolute Value Functions and Transformations • Graph and compare with y = |x| • y = |x – 2| + 3 • y = ¼ |x| • y = -3|x + 1| - 2
2.7 Use Absolute Value Functions and Transformations • Write an absolute value equation for the given graph.
2.7 Use Absolute Value Functions and Transformations • The graph of f(x) is given. Sketch the following functions. • y = -½ f(x) • y = f(x – 1) + 3
2.7 Use Absolute Value Functions and Transformations • 127 #3-37 odd + 2 choice = 20
Homework Quiz • 2.7 Homework Quiz
2.8 Graph Linear Inequalities in Two Variables • Linear Inequality in two variables • Like linear equation, but with inequality instead of = • Tell whether the given ordered pair is a solution of 5x – 2y ≤ 6 • (0, -4) • (-3, 8)
2.8 Graph Linear Inequalities in Two Variables • Graphing a linear inequality • Graph the line as if it was = • Dotted or Solid line • Dotted if <, > • Solid if ≤, =, ≥ • Shade • Test a point not on the line • If the point is a solution, shade that side of the line • If the point is not a solution, shade the other side of the line