Download
1 / 23
230 likes | 367 Vues
Accurate estimation of microbial communities using 16S tags. Julien Tremblay, PhD jtremblay@lbl.gov. 16S rRNA as phylogenetic marker gene. 21 proteins. 16S rRNA. 30S. 70S Ribosome. subunits. 50S. 5S rRNA. Escherichia coli 16S rRNA Primary and Secondary Structure. 34 proteins.

E N D
Accurate estimation of microbial communities using 16S tags Julien Tremblay, PhD jtremblay@lbl.gov
16S rRNA as phylogenetic marker gene 21 proteins 16S rRNA 30S 70S Ribosome subunits 50S 5S rRNA Escherichia coli 16S rRNA Primary and Secondary Structure 34 proteins 23S rRNA highly conserved between different species of bacteria and archaea Falk Warnecke
16S rRNA in environmental microbiology(Sanger clone libraries) 900-1100 bp length Falk Warnecke
Next generation sequencing (NGS) Read length Throughput 454 Illumina 0.5M 450bp reads $$ 10-400M 150bp reads/lane $
Game plan to survey microbial diversity V1 V2 V3 V4 V5 V6 V7 V8 V9 16S rRNA Generate amplicons of a given variable region from bacterial community (many millions of sequences) Amplicon tags = Deeper, cheaper, faster X 10 X 1 X 1,000 X 2,000 Identification (BLAST, RDP classifier) Reduce dataset by dereplication/clustering X 200 X 1,200 X 800 X 10,000
Rare biosphere High sequencing depth of NGS reveals “rare” OTUs Abundance Rare biosphere Rank Low abundance High abundance Sequencing error? Chimeras? Background noise? Relative small size of amplicons
Rare bias sphere? 27F 342R 1114F 1392R Is rare biosphere an artifact of the NGS error? Control experiment: estimate rare biosphere in a single strain of E.coli V1 & V2 V8 It should not, if relatively stringent clustering parameters are applied Subject to controversy – Is rare always real? Kunin et al., (2009), Environ. Microbiol. Quince et al., (2009), Nat. Methods
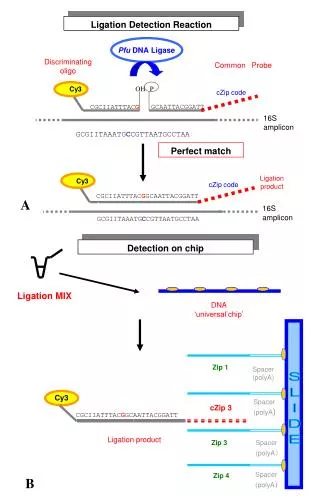
PyroTagger (for 454 amplicons) Unzip, validate Remove low-quality reads Redundancy removal PyroClust & Uclust Remove chimeras Samples comparison, post-processing pyrotagger.jgi-psf.org
Classification and barcode separation • Sequences of cluster (OTU) representatives • Blast vs GreenGenes and Silva databases, dereplicated at 99.5% • Distribution of microbial phyla in the dataset • Also see the Qiime pipeline
Illumina tags (itags) • Typical 454 run 450,000 – 500,000 reads • “Typical” Illumina run: • GAIIx 10,000,000 – 40,000,000 reads/lane • Hiseq ~ 350,000,000 reads/lane • Miseq (available soon) ~4,000,000 reads/lane • Move 16S tags sequencing to Illumina platform • HiSeq = huge output compared to 454 (suitable for big projects 1000+ indexes(barcodes)/libraries • MiSeq = moderatly high throughput (More suitable?) • throughput more efficient clustering algorithm (SeqObs).
Illumina tags (itags) ~200-220 bp ACGTGGTACTACGTGAT…. ~252 bp ACGTGGTACTACGTGATAGTGTAT 454 Illumina • 454 = “1” read • Illumina = “2” reads => have to be assembled • Both reads need to be of good quality
itags clustering Sort by alphabetical order 100% identity Reduces dataset by 80% 97% 97% Edward Kirton, JGI
Number of reads >> number of clusters 30 25 20 15 Number of reads (millions) 10 Clustering happens here! 5 0 Edward Kirton, JGI
Benefits of parallelization 25 20 15 Processing time (min.) 10 5 0 50 100 150 200 Number of reads (millions) Edward Kirton, JGI
MiSeq validation • Exploratory experiments using 11 wetlands samples. • Validate reproducibility between runs
MiSeq validation • Beta diversity (UniFrac Distances) Run 1 Run 2
itags Validating SeqObs output by comparing with pyrotagger results 454 Pyrotagger (V8 region) Synthetic communities Termite gut Surface Sediments Compost Sludge Illumina GAIIx SeqObs pipeline (V4, V5 and V9 regions) Illumina Miseq SeqObs pipeline (V4 region)
Comparing 454 with illumina GAIIx vs 454 region
Comparing 454 with illumina • Primer pair of variable region is likely to affect outcome of results. In silico PCR on 16S Greengenes database.
itags – confidence level E values Miseq 5’ reads 150 bp Miseq assembled reads ~250 bp 454 220 bp GAIIx ~110 bp
Challenges • Short size of amplicon • What filtering parameters to use (stringency level)? • balance between stringency filter and keeping as much data as we can • Whole new dimension for rare biosphere? • Handling large numbers of sample (tens of thousand magnitude) • Cost of barcoded primers (will need lots of barcodes), handling • Huge ammount of samples statistics models…
Acknowledgments • Susannah Tringe • Edward Kirton • Feng Chen • Kanwar Singh • Rob Knight lab (Univ. of Colorado) Thanks!
16S rRNA Dangl lab, UNC