Download
1 / 32
330 likes | 446 Vues
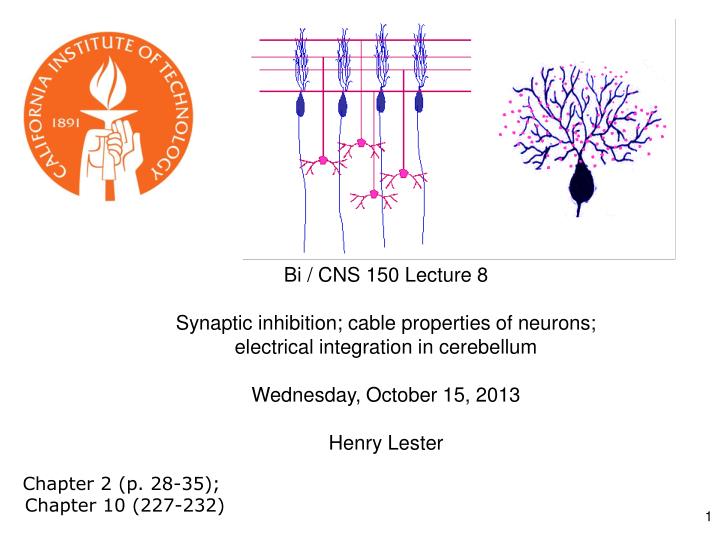
Bi / CNS 150 Lecture 8 Synaptic inhibition; cable properties of neurons; electrical integration in cerebellum Wednesday, October 15, 2013 Henry Lester. Chapter 2 (p. 28-35); Chapter 10 (227-232). Nicotinic ACh, GABA A , and glycine receptors look alike at this resolution (prev. lecture).

E N D
Bi / CNS 150 Lecture 8 Synaptic inhibition; cable properties of neurons; electrical integration in cerebellum Wednesday, October 15, 2013 Henry Lester Chapter 2 (p. 28-35); Chapter 10 (227-232)
Nicotinic ACh, GABAA , and glycine receptors look alike at this resolution (prev. lecture) ~ 2200 amino acids in 5 chains (“subunits”), MW ~ 2.5 x 10⁶ Binding region Membrane region Colored by secondary structure Colored by subunit (chain) Cytosolic region
The pentameric GABAA and glycine receptors look like ACh receptors; but they are permeable to anions (mostly Cl-, of course) 1. -amino-butyric acid (GABA) is the principal inhibitory transmitter in the brain. 2. Glycine is the dominant inhibitory transmitter in the spinal cord & hindbrain. GABAA receptors are more variable than glycine receptors in subunit composition and therefore in kinetic behavior. . . Cation channels become anion channels with only one amino acid change per subunit, in this approximate location Like a previous lecture
A Synapse “pushes” the Membrane Potential Toward the Reversal Potential (Erev) for the synaptic Channels ACh and glutamate receptors flux Na+ and K+, (and in some cases Ca2+), and Erev ~ 0 mV. At GABAA and glycine receptors, Erev is near ECl ~ -70 mV Membrane potential +80 +60 ENa +40 At Erev , the current through open receptors is zero. Positive to Erev, current flows outward Negative to Erev, current flows inward +20 -5 -20 Resting potential -50 -80 EK -100 Like Figure 10-11
Pharmacology of GABAA Receptors: activators • Benzodiazepines (= BZ below): • Valium (diazepam), (Ambien, Lunesta are derivatives) The natural ligand binds at subunit interfeces (like ACh at ACh receptors) phenobarbital site is unceratin
The AChBP interfacial “aromatic box” occupied by nicotine (prev. lecture) . . . GABA and glycine also make cation-p interactions aY198 C2 aW149 B aY93 A non-aW55 D aY190 C1 (Muscle Nicotinic numbering)
GABAA and Glycine blockers bind either at the agonist site or in the channel Strychnine (glycine receptor) Bicuculline (GABAA receptor Agonist site Picrotoxin (GABAA & glycine receptors)
How does the receptor transduce binding into channel gating? (prev. lecture) CLOSED OPEN . . . Both ideas are also in play for GABA or glycine receptors Swivel? Miyazawa, Nature 2003 Twist? Corringer, J Physiol 2010
We have Completed our Survey of Synaptic Receptors Most ^ • A. ACh, Serotonin 5-HT3, GABA, (invert. GluCl, dopamine, tyrosine) receptor-channels Figure 10-7
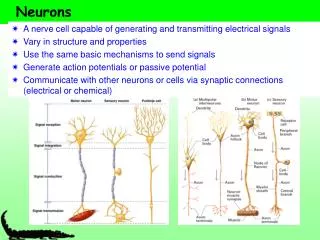
direction of information flow Postsynaptic Presynaptic neuron neuron little hill (base) (apex) Parts of two generalized CNS neurons Inhibitory terminal Excitatory terminal axon presynaptic terminal node of Ranvier initial myelin segment axon hillock cell body (soma) apical dendrites basal dendrites presynaptic terminal nucleus postsynaptic dendrite synaptic cleft Like Figure 2-1 (rotated)
10% of the neurons in the CNS are cerebellar granule cells The cerebellum: a famous circuit in neuroscience. In today’s lecture, it exemplifies pre- and postsynaptic structures. Molecular layer Purkinje cell layer Ganule cell layer White matter Figure 42-4
A plurality of synapses in the CNS (> 1013 ) occur between parallel fiber axons and Purkinje cell dendritic spines Molecular layer 500 nm
Types of synapses (Don’t mind the Type I, Type II stuff) Figure 10-3
Types of synaptic integration 1. Temporal A. Molecular lifetimes B. Capacitive filtering 2. Spatial 3. Excitatory-inhibitory
Previous lecture all molecules begin here at t= 0 units: s-1 State 1 State 2 Synaptic integration 1A. Molecular lifetimes k21 open closed Concentration of acetylcholine at NMJ (because of acetylcholinesterase, turnover time ~ 100 μs) high 0 Number of open channels ms
At the nerve-muscle synapse, acetylcholinesterase is present at densities of > 1000 / μm2 near each synapse, high enough to destroy each transmitter molecule as it leaves a receptor What causes the ~ δ-function of glutamate & GABA at CNS synapses? Na+ -coupled transporters for glutamate & GABA are present at densities of > 1000 / μm2 near each synapse, probably high enough to sequester each transmitter molecule as it leaves a receptor (more in a few slides).
1B. Temporal Summation 2. Spatial summation Recording Recording Axon Axon Synaptic Current Synaptic Potential Long time constant (100 ms) Short time constant (20 ms) Synaptic Current Synaptic Potential Long length constant (1 mm) Short length constant (0.33 mm) ~ 100 pA Vm 2 mV 25 ms Vm Improved from Figure 10-14
1. If dendrites were passive, they would act like leaky cables . . . Excitatory synapses V V EPSP measured in dendrite EPSP measured in soma Gulledge & Stuart (2005) J. Neurobiol 64:75,
. . . and passively integrate inputs . . . V V V Δt = 0 Δt = 0 Δt = 5 ms Prolonged rising phase Simultaneous, colocalized EPSPs (two individual trials) Nearly simultaneous, colocalized EPSPs (two individual trials) Simultaneous, Spatially distinct EPSPs Inspect the simulation, and run the movie, at http://www.neuron.yale.edu/neuron/static/about/stylmn.html Gulledge & Stuart (2005) J. Neurobiol 64:75,
. . . but two-photon microscopes allow researchers to visualize patch-clamped dendrites in living animals . . . Gulledge & Stuart (2005) J. Neurobiol 64:75,
25 μm . . . dendrites are not passive. They have Na channels Now break the patch, to fill the cell with dye: immunocytochemistry * = axon hillock Averaged traces Whitaker, Brain Res, 2001 Magee & Johnston, J Physiol (1995)
brain slice . . . voltage-gated Na+ and Ca2+ channels in dendrites lead to partial “backpropagation” of action potentials, implying that parts of cells can process signals semi-independently. Stay tuned! Gulledge & Stuart (2005) J. Neurobiol 64:75,
Excitatory-inhibitory integration: • The “veto principle” of inhibitory transmission Inhibitory synapses work best when they are “near“ the excitatory event they will inhibit. “Near” means < one cable length. A. Inhibitory synapses on dendrites do a good job of inhibiting EPSPs on nearby spines B. Inhibitory synapses on cell bodies and initial segments do a good job of inhibiting spikes
“Veto” inhibition at the axon initial segment: Schematic of a GABAergic “chandelier cell” in human cerebral cortex Inhibitory Chandelier Cell Ch terminals Ch. axon Pyramidal Cells Ch terminals from Felipe et al, Brain (1999) 122, 1807
Now we localize the inhibitory “vetos” of cerebellar Purkinje cells by “pinceaux” (paintbrushes) of basket cells Molecular layer Purkinje cell layer Ganule cell layer White matter Figure 42-4
How to localize and quantify inhibitory synapses NH2 A fusion protein: GABA transporter (GAT1)-GFP
<Immunocytochemistry For GABA transporter Molecular layer (basket cells stain) Purkinje cell layer “pinceux” (paintbrushes) stain heavily Granule cell layer
mGAT1 GFP knock-in fluorescence > <Immunocytochemistry For GABA transporter Molecular layer (basket cells stain) Purkinje cell layer “pinceaux” stain heavily, showing soma-hillock “veto” Granule cell layer
GAT1-GFP expression in cerebellum: basket cell terminals in molecular layer, Showing dendritic “veto” GABA transporter density is ~1000/(μm2) 50 mm