Download
1 / 26
270 likes | 515 Vues
Fish to 2030 and Some Other Perspectives. James L. Anderson Advisor for Oceans, Fisheries and Aquaculture Lead of the Global Program for Fisheries The World Bank Seafood Investor Forum May 20, 2014 Roosevelt Hotel, New York, NY. Fish to 2030 – Why?.

E N D
Fish to 2030 and Some Other Perspectives James L. Anderson Advisor for Oceans, Fisheries and Aquaculture Lead of the Global Program for Fisheries The World Bank Seafood Investor Forum May 20, 2014 Roosevelt Hotel, New York, NY
Fish to 2030 – Why? • Nearly 40 percent of global fish harvest is exported • Over $110 billion in trade and growing • Fish trade is more than all other meats combined • Two-thirds of seafood trade (in value) is from developing to developed countries • Fish trade is more than all other meats combined; more than coffee • Fisheries and aquaculture is an efficient animal protein producing sector • Sustainable food production from fisheries and aquaculture is essential in the face of population growth
Fish to 2030 Project • Collaboration: The World Bank, International Food Policy Research Institute (IFPRI), University of Arkansas, and FAO • Projection of global supply and demand for fish and fish meal & oil using IFPRI’s IMPACT Model • Capture and aquaculture supply modeled • Model: • Country groups: 115 • Seafood groups: 16
Fish sector is dynamic and complex(Modeling is challenging) • Hundreds of species traded – more than 30 shrimp species alone • It is Dynamic: • Aquaculture –new technologies, new species, new players • Demand is shifting • Large emerging consumers – China • Governance of capture fisheries is weak and uncertain • Data are poor!!!
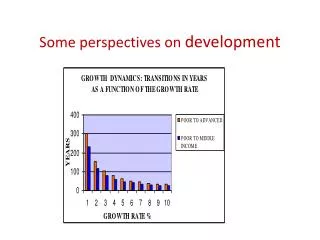
Projected Total Fish Supply Total Harvest 189.1 Million Tons
Aquaculture Growth 2030 (Model) • Approx. 50% of total harvest • Approx. 62% of fish of human seafood consumption • Aquaculture 2010-2030 – 62% in 20 yrs • Total supply (capture + aquaculture) 2010-2030 – 24% in 20 yrs
Aquaculture Supply Growth: Species • More than 90% increase from 2010 to 2030 • Tilapia • Shrimp • 40-90% increase from 2010 to 2030 • Molluscs • Salmon • Carp • Pangasius/catfish • Crustaceans • Other freshwater and diadromous species
Total Fish Supply Growth: Regions • More than 60% increase from 2010 to 2030 • India • 30-60% increase from 2010 to 2030 • Southeast Asia • Other South Asia • China
Aquaculture Supply Growth: Regions • More than 100% increase from 2010 to 2030 • India • Latin America and Caribbean • Southeast Asia • 50-100% increase from 2010 to 2030 • South Asia (excl. India) • Middle East and North Africa • Sub-Saharan Africa • Less than 50% increase from 2010 to 2030 • Everywhere else
Consumption Growth: Regions • More than 50% increase from 2010 to 2030 • South Asia (excl. India) • 30-50% increase from 2010 to 2030 • India • Southeast Asia • North America • Middle East and North Africa • China • Sub-Saharan Africa • Decline from 2010 to 2030 • Japan
Key Conclusions from 2030 study Expectations for 2030: • Aquaculture will produce 2/3 of food fish • China will consume nearly 40% of seafood • Production of tilapia, shrimp, will nearly double from 2010 to 2030 • Largest tonnage gains will be in mollusks, carps • Aquaculture will grow fastest in India, Latin America, and Southeast Asia
China: International Seafood Trade (1984-2011) China: #1 Seafood Exporter #1 Seafood Importer Source: FishStat, FAO 2014
China: International Seafood Trade (1984-2011) China: #1 Seafood Exporter #3Seafood Importer (US and Japan are #1 & #2) Source: FishStat, FAO 2014
US Seafood Consumption Continues to Concentratein Fewer Species and Per Capita Consumption is Declining
Thank You janderson8@worldbank.org http://documents.worldbank.org/curated/en/2013/12/18882045/fish-2030-prospects-fisheries-aquaculture