Download
1 / 13
140 likes | 262 Vues
Visualisation of Poverty and Social Exclusion research Joanna Mack, Stewart Lansley, Pete Mitton www.poverty.ac.uk. Funded by the ESRC Major grant – £4.3 million Start April 2010 End October 2013. The PSE research. The Research team. University of Bristol Heriot-Watt University

E N D
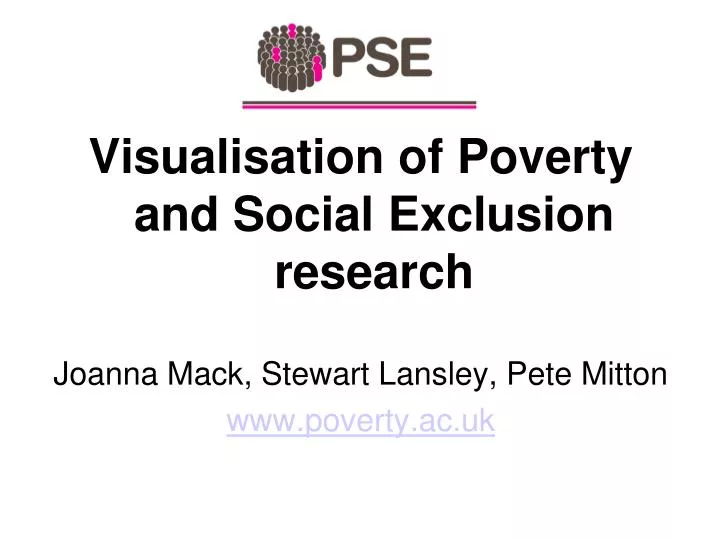
Visualisation of Poverty and Social Exclusion research Joanna Mack, Stewart Lansley, Pete Mitton www.poverty.ac.uk
Funded by the ESRC Major grant – £4.3 million Start April 2010 End October 2013 The PSE research
The Research team • University of Bristol • Heriot-Watt University • The Open University • Queen's University Belfast • University of Glasgow • The University of York
The consensual method Sees poverty as: “an enforced lack of socially perceived necessities” Examines: Social as well as material deprivation Allows for: Choice distinguishing can't afford from don't want Analyses: Lack of necessities against resources
Data • Deprivation indicators • Social Exclusion indicators • Income/resources • Necessities – from Breadline Britain onwards • Standard socio-demographic variables
Past data sets • Townsend: Poverty in the UK 1969 • Breadline Britain 1983 • Breadline Britain 1990 • PSE 1999 • PSE Northern Ireland 2002
PSE 2011 - data Two stage survey: • Necessities survey using the NatCen Omnibus survey in Britain and the NISRA Omnibus survey in February/March 2011 2. Standards of living survey following up the Family Resources Survey between September 2011 and January 2012 with 4,000 households in Britain and further 800 in NI
The long term aims Make the data available on the website allowing • Comparisons across time • Comparisons across place • Aggregation with public data • Individual identities to be kept private
International data Looking for access to data from similar “necessities” based surveys of poverty in: Japan, Taiwan, Mexico, Brazil, South Africa, Bangladesh, New Zealand, Australia, Germany, France, Ireland, Finland, Sweden, EU including Eurobarometer and others
Heatmaps of adult and child necessities Eurobarometer data
Statistical education Mis-understanding the median…. ‘You get this constant juddering adjustment with poverty figures going up when, for instance, upper incomes rise.’ Iain Duncan Smith ‘Any candidate sitting GCSE maths should be able to explain that raising everybody above a set percentage of the median income is rather like asking a cat to chase its own tail. As families are raised above the target level of income, the median point itself rises. Not surprisingly, therefore no country in the free world has managed to achieve this objective.’ Frank Field http://www.poverty.ac.uk/income_threshold_approach.php
Multiple views, user control and error bars Obesity http://www.sepho.nhs.uk/NOO/e-Atlas/adult/atlas.html