Download
1 / 18
180 likes | 285 Vues
2 – 3: Quick Graphs of Linear Equations. Objective: CA Standard 17: Use the slope – intercept form of a linear equation to graph a linear equation. Use the standard form of a Linear equation to graph linear equations.

E N D
2 – 3: Quick Graphs ofLinear Equations Objective: CA Standard 17: Use the slope – intercept form of a linear equation to graph a linear equation. Use the standard form of a Linear equation to graph linear equations.
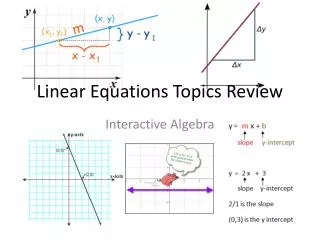
If the graph of an equation intercepts the y-axis at (0, b), then the number b is the y-intercept of the graph.
Graphing equations in slope – intercept form. The slope intercept form of an equation gives you a quick way to graph the equation. Step 1. Write the equation in slope – intercept form by solving for y. Step 2. Find the y-intercept and use it to plot the point where the line crosses the y-axis. Step 3. Find the slope and use it to plot a second point on the line. Step 4. Draw a line through the two points.
Example 1: Graphing with the Slope – intercept form. Step 1: Write the equation in slope – intercept form by solving for y.
Step 2: Find the y-intercept and use it to plot the point where the line crosses the y-axis. The y-intercept is (0, -2). Plot (0, -2) Step 3: Find the slope and use it to plot a second point on the line. The slope is ¾. From the point (0, -2) go up 3 units and over to the right 4 units. (4, 1)
Step 4: Draw a line through the two points (0, -2) and (4, 1).
Standard Form of a Linear Equation The standard form of a linear equation is Ax + By = C where A and B are not both zeros.
Graphing Equations in Standard Form The standard form of an equation gives you a quick way to graph the equation: Step 1: Write the equation in standard form. Step 2: Find the x-intercept by letting y = 0 and solving for x. Use the x-intercept to plot the point where the line crosses the x-axis.
Step 3: Find the y-intercept by letting x = 0 and solving for y. Use the y-intercept to plot the point where the line crosses the y-axis. Step 4: Draw a line through the two points.
Example 3: Draw Quick Graphs Graph 2x + 3y = 12 Step 1: The equation is already in standard form. Step 2: 2x +3y = 12, let y =0 2x + 3(0) = 12 2x =12 x = 6 The x-intercept is (6, 0)
Step 3: 2(0) + 3y = 12, let x = 0 3y =12 y = 4 The y-intercept is (0, 4)
Step 4: Plot the two points (6, 0) and (0, 4), then draw a line through them.
Horizontal and Vertical Lines Horizontal Lines: The graph of y = c is a horizontal line through (0, c). Vertical Lines: The graph of x = c is a vertical line through (c, 0). C is a constant.
HOMEWORK • P. 86 #25-35 Odd, #43-51 EOO
Example 4: Graphing Horizontal and Vertical Lines Graph y = 3 and x = -2
Example 2: Using the Slope – Intercept Form To buy a $ 1200 stereo, you pay a $200 dollar deposit and then make weekly payments according to the equation a = 1000 – 40t, where a is the amount you owe and t is the number of week. a. How much do you originally owe? 1200 – 200 = 1,000