Download

1 / 29
290 likes | 587 Vues
Terrell Preventable Readmission Project. Jeylan Buyukdura & Natalie Davies. Presentation Overview. Introduction Analysis of the Situation Technical Description Analysis Q & A. Introduction. Background, Objective and Development. Problem Background.

E N D
Terrell Preventable Readmission Project JeylanBuyukdura & Natalie Davies
Presentation Overview • Introduction • Analysis of the Situation • Technical Description • Analysis • Q & A
Introduction Background, Objective and Development
Problem Background • Patients treated at Terrell State Hospital & Green Oaks ER • Patients readmitted into ER within 30 days of TSH discharge. • Extra expenses for the State could be preventable. • Overall health of patients could be stabilized. • Find a way to help reduce these readmission numbers.
Development Approach • Build a model to help predict the type of patient that may be readmitted within 30 days. • Focus on the patient’s characteristics. • Find commonalities among this specific group of patients. • Use SAS to formulate new data sets and build a model.
Analysis of the Situation • Met with supervisor Margaret Balfour to discuss the goals of this project, and how the Behavior Health system works in TX. • Data Sets Given (de-identified): • Claims at Terrell State Hospital • Claims at Green Oaks ER • (For FY 2008-2010 & in SAS format) • What is the best way to evaluate what these patients have in common?
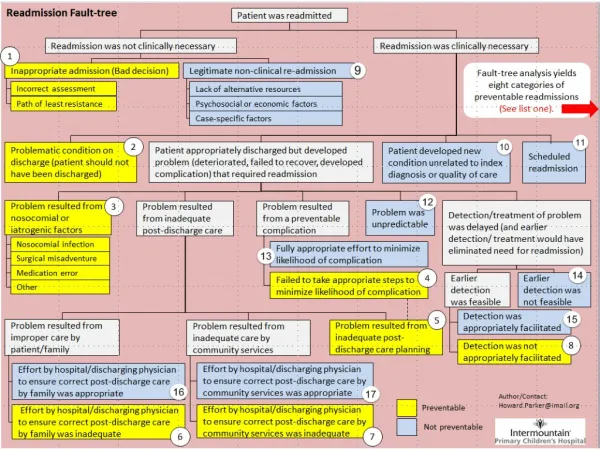
Readmission in 30 days ** We visited TSH and these were common perceived reasons for readmission
Technical Description Using SAS
Merge Data Sets • ****Learn some SAS code!**** • Merged based on patient’s case number. • Merging TSH and Green Oaks Claims
Only FY 2010 • Model would be easier to develop while focusing on a smaller group. • Struggled with SAS dates to identify difference between patients’ discharge and readmission dates.
Identify Cohort Patients • Any patient who was discharged from TSH and readmitted into Green Oaks within 30 days was considered a “cohort” patient. • Every patient was assigned either a “1” or “0” as their cohort variable. • The Decision Dependent Variable
Independent Variables • Identified as: • Patient’s primary, secondary, and tertiary diagnosis (DIAGNoneDIAGNtwoDIAGNthree) • Sex (Male= 0; Female =1) • Race (Black=0; Other =1; White=2; Hispanic=3; Asian=4 ) • Age • If they were an adult (adult) • If they were homeless (homeless2010) • The evaluation of the level of care needed after discharge (trag2010) • If they were one of the system’s annual most expensive patients (top200) • The cost of their stay at TSH (cost) • Length of stay at TSH (LOS). Note: All Binary Variables were given 1 if True, and a 0 if False.
Grouping Variables • Some variables had many possible values, so we grouped into smaller segment for an easier output. • Age was divided into 10’s (0-10, 20-30, etc.) • Length of stay at TSH was segmented into 0-3, 3-6, 6-12, 12-24, and 24+ weeks • Cost of stay at TSH was segmented into • $0 – $5K; $5K – $10K; $10K – $20K; $20K – $50K and $50K+
Grouping Variables Cont. • Individual Diagnoses • Schizophrenia andSchizo disorders • Mood disorders (depression and bipolar disorder) • Physical mental disorders (autism and brain injuries) • Other psychiatric disorders not otherwise categorized (anxiety and OCD) • Personality disorders • Substance abuse
Logistical Regression & Output • GOAL: Something that doctors can enter patient data into and it will predict if they are likely to be readmitted within 30 days or not. • Ran in both SAS 9.2 and SAS Enterprise Versions. • SAS 9.2: • Intercept • Coefficients for the independent variables • Level of accuracy for both the model and the coefficient values for each variable • SAS Enterprise: • Visual Representations of the same information
Model • y + (a X x1) + (b X x2) = 1/0 • yas an intercept • a and b as independent variable values • x1 and x2 as coefficients • (y, x1, and x2 will be given from the logistical analysis, a and b will be new data)
Analysis Estimates and Observations
Logistical Analysis • Unable to construct our model due to time constraint, but able to use regression output and analyze the results. • Overall Chi Squared p value for the logistical model was <0.001 = Model was statistically significant (<0.05) in describing the data. • Other Analysis: • Analysis of Maximum Likelihood Estimates • Odds Ratio Estimate
Analysis of Maximum Likelihood Estimates • Coefficients for theIndependent Variables • We had 5 statistically significant coefficients • Primary Diagnosis (DIAGNone) was a significant predictor if the patient had a diagnosis in the categories of schizophrenia(estimate=0.9557, p=0.0010) • Mood Disorders (estimate=0.7920, p=0.0072) • Other Psychiatric Disorders (estimate=1.2895, p=<0.001) • Secondary Diagnosis (DIAGNtwo) was a significant predictor if the patient had a personality disorder (estimate=0.-0.8932, p=0.0226) • Patient was in the Top200(estimate=1.1284, p<0.001)
Odds Ratio Estimates Observations • Describes how much more likely a patient is to be in the cohort (readmitted within 30 days) if they have one value in a variable over another. • i.e. Patients who’s stay cost at TSH was $5,000-10,000 were 17.281 times more likely to be readmitted than patients who’s stay cost was $50,000+. And after a patients cost of stay exceeds $20,000 they are only slightly less likely to be readmitted if their • Showed that a patient was much more likely to be readmitted the shorter their stay was at TSH. (But 95% confidence levels were large) • Similar to a patient’s LOS
Observations Cont. • A patient was slightly less likely to be readmitted if they were male (estimate = 0.859, 95% confidence intervals 0.642-1.149) • The race most likely to be readmitted was Asian. • A patient was surprisingly about as likely to be readmitted if they were homeless as if they were not (estimate = 0.988, 95% confidence intervals 0.636-1.535). • The TRAG variable showed that if a patient was given a lower level of care after being discharged they were more likely to be readmitted (estimate=1.513, 95% confidence intervals 0.910-2.515).