Download
1 / 31
310 likes | 415 Vues
Historical emissions a new 1860-2000 inventory of emissions of gases and particles Claire GRANIER Service d’A é ronomie/IPSL, Paris CIRES/NOAA Earth System Research Laboratory Aude MIEVILLE , Service d’A é ronomie/IPSL, Paris Cathy LIOUSSE and Bruno GUILLAUME ,

E N D
Historical emissions a new 1860-2000 inventory of emissions of gases and particles Claire GRANIER Service d’Aéronomie/IPSL, Paris CIRES/NOAA Earth System Research Laboratory Aude MIEVILLE,Service d’Aéronomie/IPSL, Paris Cathy LIOUSSE and Bruno GUILLAUME, Laboratoire d’Aerologie, Toulouse, France
Emissions of gases and aerosols from: technological emissions biomass burning emissions What is missing/not well taken into account What could be done over the next few months
Technological emissions: General equation used to generate emissions: Emission = Σ Ai EFi P1i P2i Ai = Activity rate for a source (ex: kg of coal burned in a power plant…) EFi = Emission factor : amount of emission per unit activity (ex: kg of sulfur emitted per kg burned P1i, P2i, … = parameters applied to the specified source types and species (ex: sulphur content of the fuel, efficiency, …) Emissions calculated for different categories of emissions
Species : CO, CO2, NOx, NMVOCs, SO2, BC, OCpPeriod : 1860-2030 Anthropogenic sources included : fossil fuel and biofuel combustion sources not included : ships, waste burning, solvent production and animals (could be taken from the RETRO inventory) Bottom-up method used to derive emission inventories based on Junker and Liousse, ACPD, 6, 4897, 2006 Emissions provided country by country Spatialization using GISS population map modified for large political changes Different algorithms for 1860-1949, 1950-2003 and 2003-2030
Different algorithms for 1860-1949, 1950-2003 1950-2003 1860-1949 Crude oil separated into Diesel and Gasoline extrapolation from UN data for each country group and activities) Fuels over three sectors :extrapolation from UN data for each country group Country classification <1940 : only 2 classes See Table of EF values NB : Data for Biofuel consumption for the 1860-1969 period : extrapolation from UN data and population trends for each country group and each activities
Still no agreement: Emission Factors CO NOx SO2 NMVOC CO2 First step : gaseous EF constant over time
EF(BC)… EF values: changing with time? Values for present Evolutive EF for BC and OCp EF (BC) Trends for Coal EF from trends of power plant efficiency Trends for Diesel from Yanowitz et al., 2000 EF (OCp)…
Change in the distribution of anthropogenic emissions of CO from 1900 to 2000
Change in the anthropogenic emission of CO2 and CO for several large areas from 1900 to 1997.
What needs to be further evaluated 1. Impact of uncertainties on BC emissions factor Emission factors from Cooke et al., JGR, 1999 Emission factors from Bond et al., JGR, 1999
Our inventory Using T. Bond Emission Factorss Large differences in spatial distribution Total emitted: Our inventory for BC: 4.8 Tg / year T. Bond’s inventory from AEROCOM: 4.7 Tg / year [Need to check that units are the same] Detailed intercomparison of BC inventory for 2000
What needs to be improved 2. Emissions in China RAES 1995-2000 “corrected” inventory for China is now available: it will be used to update our current inventory (from Akimoto Frontier’s group) NO2 tropospheric column in China; From Richter, Burrows, Nuess, Granier and Niemeier, Nature, 2005 Coal production by types of coal Source: China Coal Industry Yearbook
What could be improved 3. Temporal variation How to implement such temporal profiles? detailed data only easily and freely available for UK Season VOCs CO weekly emissions NOx diurnal emissions
Use of NO2 satellite data? Significant differences between the 3 available retrievals from: - University of Bremen - KNMI, The Netherlands - University of Nova Scotia From Van Noije et al., ACP, 2006
Results from MOZART-4 simulations CO surface emission Surface CO february 100*(CO_seas –CO_no_season)/CO_seas 100*(CO_seas –CO_no_season)/CO_seas august 100*(CO_seas –CO_no_season)/CO_seas 100*(CO_seas –CO_no_season)/CO_seas Importance of the seasonal variation of surface emissions on the seasonal variation of surface concentrations.
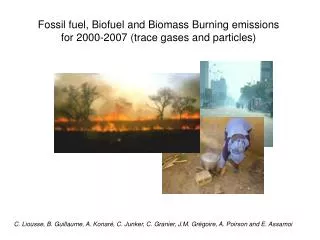
Biomass burning emissions: large contribution to total emissions
calculating the emissions per gridbox M(X) m : amount of species X emitted per month m n: number of ecosystems (5) EFk(X): emission factor for species X per ecosystem Ai: area burnt per month βk: combustion efficiency for ecosystem k AFL k: available fuel load per ecosystem fc t: fractional cover of PFT t per gridbox t: number of PFT’s (9) p: number of carbon pools (5) t,p: susceptibility factor m t,p : dry matter per PFT and carbon pool
1900 – 2000 Biomass burning emissions • Two steps: • 1997-2003: Use of satellite data • For 2000: • GBA-2000 burned area product • GLC vegetation map • Both products developed by the JRC, Ispra, Italy • Only available for 2000 [Burned area product are expected to be available for several years. When?] • For other years: use of active fires from ATSR
GLC vegetation map Methodology – biomass burning emissions 1997-2003 Data used GBA 2000 burnt areas for 2000 ATSR Fire Counts 1997 -2003
Methodology – biomass burning emissions 2000 Burnt area per vegetation type CO2 emissions per vegetation type x BD x BE x EF Other years: scaling of ATSR fire counts, using 2000 as a basis
2. 1900-1996 biomass burning emissions: Use of historical data • Use of data compiled by Mouillot and Field: • Fire history and the global carbon budget: a 1x1 degree fire history reconstruction for the 20th century, Global Change Biology (2005) 11, 398–420. • Calculate CO2 emissions for the 1990-2000 decade as the product : • Emissions(CO2) = BA x BD x BE x EF(CO2) • BA = Burnt Area (from Mouillot et al. paper) • BD = Biomass Density • BE = Burning Efficiency (Use GLC 2000 map) • EF(CO2) = Emission Factor for CO2 (from Andreae and Merlet, 2001) • Scale 1990-2000 CO2 emissions from forest/savanna burning so that they equal the 1997-2003 previously calculated • Use the same scaling for all other decades considering forest and savanna burning separately
Burned areas (in m^2) for the 1900-1910 and 1990-2000 decades 1900-1910 1990-2000
1900-1910 CO2 emissions for the 1900-1910 and 1990-2000 decades (in 1.e13 molec/cm2/s) Not taken into account: Change in vegetation distribution over the 20th century. Any existing data? 1990-2000
CO2 emissions resulting from biomass burning during the 20th century
CO and NOx emissions resulting from biomass burning during the 20th century
Summary: Difference in Anthrop+biomass burning emissions 2000-1900
1st version of the inventory • Simulations using these emissions will start this week 1st set of simulations: steady-state, 1900 and 2000 • Improvements/corrections planned, based on simulations results First question we want to look at: are these new emissions compatible with the very low ozone concentrations measured at the beginning of the 20th century? 1st step: use MOZART-4 2nd step: use coupled model with dynamical vegetation/ changing land use
What could also be developed using the same method: Future projections at the global scale for 2010-2030 New projections by using the POLES model including both fossil fuel and biofuel emissions (Junker and Liousse, IGAC 2006). Reference scenario : Reflect the state of the world with what is actually (2000) embodied as environmental policy objectives CCC scenario : Introduction of carbon penalties as defined by Kyoto for 2010 and a reduction of 37 Gt of CO2 in 2030. • First step : • - EF for gases constant over time • BC and OCp : • EFs for the Reference scenario : equal to today’s • Reduction of EF for the CCC scenario : • Developed countries : based on removal efficiency forecast by the IIASA Rains model • Semi-Developed countries : EFs of developed countries of 2000 • Under-Developed countries : EFs of semi-developed countries of 2000
Also contributed to the development of the inventory: Jean-Francois LAMARQUE, NCAR Florent MOUILLOT, CEFE, Montpellier, France Jean-Marie GREGOIRE, Joint Research Center, Ispra, Italy
Themes: • Emissions • Atmospheric chemistry • Modeling • Chemistry-climate interactions