Download
1 / 7
100 likes | 633 Vues
8. Candle Burning Times. Scientific Enquiry Question. The diagram shows a candle burning in air under a bell-jar. The class were shown this demonstration, then they had to plan their own experiment.

E N D
8. Candle Burning Times Scientific Enquiry Question
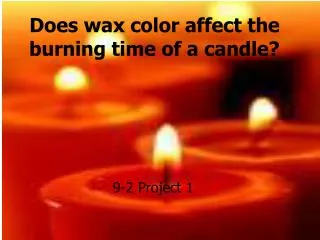
The diagram shows a candle burning in air under a bell-jar. The class were shown this demonstration, then they had to plan their own experiment. They had to find out if there was a relationship between volume of container and burning time.
The pupils set up a similar different sizes of beaker. They lit the candle, carefully put the beaker over the top of it and timed how long it took for the flame to go out. This was repeated 3 times for each beaker. (b) The results from one group of pupils are given below. (i) Calculate their average burning times. Put the answers in the table
(ii) In this experiment each part of the experiment was repeated 3 times. Why is it often a good idea to repeat the readings? ____________________________________ (c) Plot a graph to show group’s results. The graph must have title that makes it clear what has been done. The axes must be labeled to show the dependent and independent variables. Any suspect or odd points must be made clear. (if there are any) A best-fit line should be drawn. Attach your graph paper to this sheet
Graph to show how the beaker volume affects the average burning time of a candle X X Average burning time (s) 0 2 4 6 8 10 12 14 16 18 20 X X 0 100 200 300 400 500 600 Beaker volume (ml)
(d) Describe the relationship (or pattern) you can see in the graph. _____________________________________ _____________________________________ (d) Use the graph to help you answer the next section of questions. What burning times would you expect in the following beakers? (i) 500 ml ________ (ii) 50 ml _______ (iii) 800 ml ________
(e) Explain why you would be more confident about the answer you gave for the 500 ml beakers than the answers for the 50 and 800 ml beakers. (f) It looks as if the results were quite reliable overall and so the strength of evidence for the conclusion could be fairly strong. However, no experiment is likely to be perfect. Go back and look at the diagram and the brief method again. Point out possible sources of error in this experiment.