Download
1 / 41
410 likes | 615 Vues
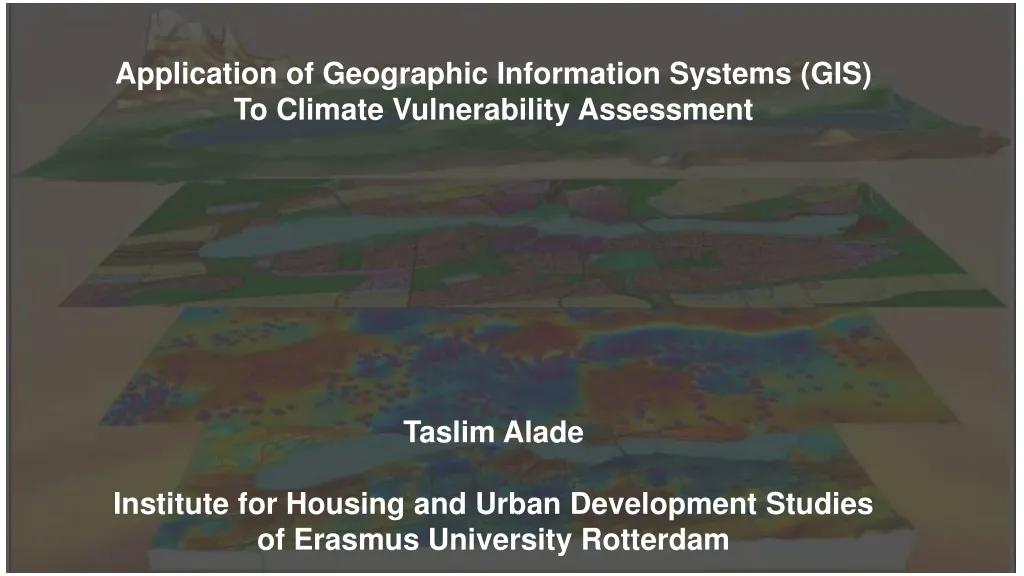
Application of Geographic Information Systems (GIS) To Climate Vulnerability Assessment Taslim Alade Institute for Housing and Urban Development Studies of Erasmus University Rotterdam. Presentation Outline. GIS and its importance for vulnerability assessment Vulnerability assessment

E N D
Application of Geographic Information Systems (GIS) To Climate Vulnerability Assessment TaslimAlade Institute for Housing and Urban Development Studies of Erasmus University Rotterdam
Presentation Outline • GIS and its importance for vulnerability assessment • Vulnerability assessment • Benefits of vulnerability mapping • GIS and Remote sensing for vulnerability assessment • Different types of data used for specific vulnerability assessments • GIS Applications for Stages of Disaster Management • Determination of the greatest risks zones and their potential consequences • United Nations International Charter and Major Disasters to provide vulnerability assessments
Disadvantages • No specific scale or extent of coverage • No modeling scenarios for impact assessment • No geo-coding and time series updates • No database for attributes • No rapid response analysis for vulnerability maps • Data loss overtime due to analogue nature • No synergy between organizations for synchronized GIS system or NGDI. Story – How we analyze spatial events (hazards) before the use of GIS A Hazard Map showing the key resources and the hazards affecting them
What is GIS? A GIS is a computer–assisted system for the acquisition, storage, analysis and display of geographic data.
Urban GIS layers Planning map layers Building layer, Land use layers Network and admin. boundaries layers Natural resource layers Satellite image, Ortho-rectified Topographical base maps A geographic information system (GIS) lets us visualize, question, analyze, and interpret data to understand relationships, patterns, and trends (Esri, 2016). 4.3.1 GIS
GIS as an Inclusive Decision Support Systems for Vulnerability Assessment Stakeholders participation and provision of spatial and non spatial data for real-time and trend scenarios
Take a case of constructing a Dyke or Flood barriers within a city or country for Ecology or Economic Vision
New Orleans from NigeriaSat-1 showing the effect of Hurricane Katrina Mississippi Delta and New Orleans as well as coastal regions eastwards to Gulfport, Biloxi and beyond. USA NigeriaSat-1, 2nd Sept 2005 Source: NASRDA, 2010
Vulnerability • …“Vulnerability is the real driver for disaster risk, and hazard is merely the trigger” [David Alexander (2013), after Kenneth Hewitt (1983)] Dimensions of vulnerability • Physical • Economic • Social • Ecological • Cultural • Institutional Key (Causal) Factors For Vulnerability 1 Exposure 2. Susceptibility (fragility) 3. Lack of resilience or societal response capacity 4. Hazard
Durability of Housing, Addis Ababa, Sub-city Level (source UN-Habitat 2004)
Satellite Image of a slum area in Nairobi and basic statistics of three neighborhoods (sub-locations)
Kibera formal/informal settlement – Different levels of drainage infrastructure and proneness to flood Population, extent of damage and compensation amounts can be approximated using this imagery for GIS analysis
GIS and Remote Sensing CLASSIFICATION of Objects on ground Unsupervised Supervised • Computer assign the image’s pixel to a defined number of classes based on their value in different channels (i.e. no training areas used) • Then Image analyst determines the land cover identity of the spectral groups by comparing the classified image data with ground reference data. • Image analyst picks out areas of an image that he is familiar with (e.g. fields of corn; water) and letting the computer find other pixels in the image that share the same/similar channel value. • Require a training site/sample sites • Then the Computer will classify the image by comparing the Pixel values of the interpretation key to each pixel in the image.
Examples of Classification Classification from linear filter: Unsupervised Original Image Classification of the Image through Sample Sets.
The appearance of different surface features for the different composite images is summarized Appearance of Features on Composite Images.
Information extraction for Geo-data base 3important criteria to evaluate data usefulness 1. Content; are the variables relevant/useful 2. Quality; are the data reliable, up-to-date 3. Size and Coverage Map Source: Alade and Adepoju, 2010
BUILDING/STRUCTURES IDENTIFICATIONS FROM SATELLITE IMAGERY NDE Building Wuse Zone 2 Post Code: FC3 2AX NIPOST HQTRS Garki Area 11 Post Code: FC 2 14BK
Identification & Mapping of Settlements, Major Roads & Water Bodies Final composite map of part of Anambra State, Nigeria showing the extracted features from the satellite images Part of Anambra State Source: NASRDA, 2010
Map produced after information extraction from satellite imagery
GIS Applications for Stages of Disaster Management • Prevention: Actions taken in disaster-prone areas in order to limit the consequences of a possible shock • Preparedness: Identifies human and material resources needed during a specific possible disaster. • Response: Issues warnings and evacuations. Shelters are prepared, actions are taken, and the situation is assessed. • Recovery: Focuses on cleanup and rebuilding, concentrating on the longer-term response to the disaster.
The Information and Data Required for Impact, Vulnerability and Adaptation Assessment and Planning Policy relevant impact and vulnerability assessment and effective adaptation planning requires a large range of data and information such as: climatic data, including • Systematic observations of temperature, precipitation, weather patterns and hazards; • Non-climatic data, including environmental, socio-economic and technical information • and historic, local and traditional knowledge.
Climatic Data Used in GIS for Mitigation and Preparation for flood and drought
Use of topographic map as a dataset for GIS analysis in Vulnerability assessment
Early Warning System as a Preparation against flood disaster
Response Stage to assess flood situation and GIS Data Use for Change Detectionof the Great flood from Mississippi river Before flood on August 14, 1991 Connected also to Illinois and Missouri river After flood - August 19, 1993..
Use of GIS and Remote Sensing in pre/post flood scenario (Disaster Response)
GIS used in suitability analysis as a response for IDP settlements of flood victims
Accessibility Scenario 1: Better area of relocation (higher elevation, closer proximity to rail transport at Jibi stop with space and good proximity to facilities at Gbazango settlement) Assumed area of flood Source: Alade, 2013
Benefits of Vulnerability Mapping • Improved communication about risksand what is threatened • Better visual presentations andunderstanding of the risks and vulnerabilities • Allows for decisionon mitigating measures • Prevent or reduce loss of life, injury and environmental consequences beforea disaster occurs or determine where to respond first and best evacuation routes • Used as overlay onflood inundation and slope stability zoneswith property maps to determine buildingsat risk on water inundation or slope failure
Shared experiences from the United Nations Disaster Charter Sharing my experience about the scientific procedure as one of the project managers for the charter – Talk session
Vulnerability Assessment as a component of UN Disaster Charter activation
Torrential rains triggered floods and landslides on Indonesia's Java Island • Garut district - worst affected. • 36 people killed • 22 are missing • over 6000 people left homeless. • City's business district brought to a halt. • Jakarta's police force with the government begun to evacuate affected communities and provide inflatable boats. How many? • The president of Jakarta - anti-flood projects as the city is prone to intense flooding during monsoon season. Acquired: Pre-disaster: 09/06/2014 - Post-disaster: 07/10/2016 UN Disaster Charter activation
UN Disaster Charter activation, 2016 In west java, showing heavily damaged Settlements in red triangles