Download
1 / 28
280 likes | 530 Vues
Probability and the Sampling Distribution. Quantitative Methods in HPELS 440:210. Agenda. Introduction Distribution of Sample Means Probability and the Distribution of Sample Means Inferential Statistics. Introduction. Recall: Any raw score can be converted to a Z-score

E N D
Probability and the Sampling Distribution Quantitative Methods in HPELS 440:210
Agenda • Introduction • Distribution of Sample Means • Probability and the Distribution of Sample Means • Inferential Statistics
Introduction • Recall: • Any raw score can be converted to a Z-score • Provides location relative to µ and • Assuming NORMAL distribution: • Proportion relative to Z-score can be determined • Z-score relative to proportion can be determined • Previous examples have looked at single data points • Reality most research collects SAMPLES of multiple data points • Next step convert sample mean into a Z-score • Why? Answer probability questions
Introduction • Two potential problems with samples: • Sampling error • Difference between sample and parameter • Variation between samples • Difference between samples from same taken from same population • How do these two problems relate?
Agenda • Introduction • Distribution of Sample Means • Probability and the Distribution of Sample Means • Inferential Statistics
Distribution of Sample Means • Distribution of sample means = sampling distribution is the distribution that would occur if: • Infinite samples were taken from same population • The µ of each sample were plotted on a FDG • Properties: • Normally distributed • µM = the “mean of the means” • M = the “SD of the means” • Figure 7.1, p 202
Distribution of Sample Means • Sampling error and Variation of Samples • Assume you took an infinite number of samples from a population • What would you expect to happen? • Example 7.1, p 203
Assume a population consists of 4 scores (2, 4, 6, 8) Collect an infinite number of samples (n=2)
Total possible outcomes: 16 p(2) = 1/16 = 6.25% p(3) = 2/16 = 12.5% p(4) = 3/16 = 18.75% p(5) = 4/16 = 25% p(6) = 3/16 = 18.75% p(7) = 2/16 = 12.5% p(8) = 1/16 = 6.25%
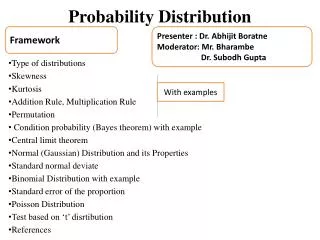
Central Limit Theorem For any population with µ and , the sampling distribution for any sample size (n) will have a mean of µM and a standard deviation of M, and will approach a normal distribution as the sample size (n) approaches infinity If it is NORMAL, it is PREDICTABLE!
Central Limit Theorem • The CLT describes ANY sampling distribution in regards to: • Shape • Central Tendency • Variability
Central Limit Theorem: Shape • All sampling distributions tend to be normal • Sampling distributions are normal when: • The population is normal or, • Sample size (n) is large (>30)
Central Limit Theorem: Central Tendency • The average value of all possible sample means is EXACTLY EQUAL to the true population mean • µM = µ • If all possible samples cannot be collected? • µM approaches µ as the number of samples approaches infinity
µ = 2+4+6+8 / 4 µ = 5 µM = 2+3+3+4+4+4+5+5+5+5+6+6+6+7+7+8 / 16 µM = 80 / 16 = 5
Central Limit Theorem: Variability • The standard deviation of all sample means is denoted as M • M = /√n • Also known as the STANDARD ERROR of the MEAN (SEM)
Central Limit Theorem: Variability • SEM • Measures how well statistic estimates the parameter • The amount of sampling error between M and µthat is reasonable to expect by chance
Central Limit Theorem: Variability • SEM decreases when: • Population decreases • Sample size increases • Other properties: • When n=1, M = (Table 7.2, p 209) • As SEM decreases the sampling distribution “tightens” (Figure 7.7, p 215) M = /√n
Agenda • Introduction • Distribution of Sample Means • Probability and the Distribution of Sample Means • Inferential Statistics
Probability Sampling Distribution • Recall: • A sampling distribution is NORMAL and represents ALL POSSIBLE sampling outcomes • Therefore PROBABILITY QUESTIONS can be answered about the sample relative to the population
Probability Sampling Distribution • Example 7.2, p 209 • Assume the following about SAT scores: • µ = 500 • = 100 • n = 25 • Population normal • What is the probability that the sample mean will be greater than 540? • Process: • Draw a sketch • Calculate SEM • Calculate Z-score • Locate probability in normal table
Step 1: Draw a sketch Step 2: Calculate SEM SEM = M = /√n SEM = 100/√25 SEM = 20 Step 3: Calculate Z-score Z = 540 – 500 / 20 Z = 40 / 20 Z = 2.0 Step 4: Probability Column C p(Z = 2.0) = 0.0228
Agenda • Introduction • Distribution of Sample Means • Probability and the Distribution of Sample Means • Inferential Statistics
Looking Ahead to Inferential Statistics • Review: • Single raw score Z-score probability • Body or tail • Sample mean Z-score probability • Body or tail • What’s next? • Comparison of means experimental method
Textbook Assignment • Problems: 13, 17, 25 • In your words, explain the concept of a sampling distribution • In your words, explain the concept of the Central Limit Theorum