Download
1 / 26
260 likes | 350 Vues
Gridded Biome-BGC Simulation with Explicit Fire-disturbance. Sinkyu Kang, John Kimball, Steve W. Running Numerical Terradynamic Simulation Group, School of Forestry, Univeristy of Montan. Purpose. Demonstrate Gridded Biome-BGC run in BOREAS.

E N D
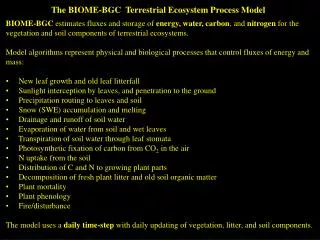
Gridded Biome-BGC Simulation with Explicit Fire-disturbance Sinkyu Kang, John Kimball, Steve W. Running Numerical Terradynamic Simulation Group, School of Forestry, Univeristy of Montan
Purpose Demonstrate Gridded Biome-BGC run in BOREAS. Illustrate Biome-BGC modification for explicit fire-disturbance simulation
Process of Gridded BGC • Batch run of Biome-BGC combined with input and output modules • Using IDL platform Spatial & temporal data INI, EPC, MET file for point Biome BGC run Batch run of point Biome BGC Generate gridded outputs
Considering Explicit Fire-Disturbance Raw Data Size and location Before 1959: constant fire mortality After 1959: external fire mortality from the raw data
Considering Explicit Fire-Disturbance Generate fire grid Year cell[i,j] annual fire file 83 84 85 86 87
Considering Explicit Fire-Disturbance Modifed INI & EPC files 1.0 (DIM) multiplier for shortwave radiation CO2_CONTROL (keyword - do not remove) 1 (flag) 0=constant 1=vary with file 2=constant, file for Ndep 286.923 (ppm) constant atmospheric CO2 concentration kco21862.txt (file) annual variable CO2 filename FIRE_CONTROL (keyword - do not remove) 1 (flag) 0=constant fire mortality 1=vary with file fire-5-14.txt (file) annual variable fire mortality (year fire_mortality) SITE (keyword) start of site physical constants block Run Modified Biome-BGC ECOPHYS ENF-cool (wet conifer) 1 (flag) 1 = WOODY 0 = NON-WOODY ……………………………………………………. 0.005 (1/yr) annual whole-plant mortality fraction 0.005 (1/yr) mean annual fire mortality fraction 0.26 (1/yr) annual carbon fraction consumed by fire 1.5 (ratio) (ALLOCATION) new fine root C : new leaf C 1.1 (ratio) (ALLOCATION) new stem C : new leaf C
ET (mm/y) & NPP (gC/m2/y) LAI (m2/m2) Daily fire mortality Constant fire mortality > 1959 < Explicit fire occurrence Internal fire-disturbance External fire-disturbance
Modification of Biome-BGC • Biome-BGC v.411 • 47 source files • 8 header files • 2 library files • In this study, even this small change demanded • modification of 7 source files • modification of 4 header files • addition of a new subroutine source file
Application to the Boreal Forest Biome Experimental Design Grid size (simulation unit): 66 columns and 60 rows (ca. 660300km2) Each simulation uses • identical land cover and soil property over the entire grid • identical spatial meteorological variable (1994~1996) Every simulation differs in • land cover types (DBF, Grass, DC, WC) • constant or varying ambient CO2 and internal or external fire-disturbance • Nine climate change scenario (control, 2oC, 20% precipitation) Total 108 cases of gridded Biome-BGC runs
Land Cover 300km 660km
Topography N N
Climate (3-yr mean) Tmax Tmin Precipitation Radiation
Sample Result 1 – Land cover DBF (412, 87.5 g/m2) Grass (347, 48.6 g/m2) DC (279, 26.2 g/m2) WC (140, 8.7 g/m2)
Sample Result 2 – CO2 WC, Const. CO2 (140, 8.7 g/m2) Difference (23, 2.8 g/m2) Const. CO2 – Increasing CO2 WC, Increasing CO2 (163, 11.1 g/m2)
Sample Result 3 - Fire Difference (-1.4, 3.7 g/m2) External fire – Increasing CO2 WC, Increasing CO2 (163, 11.1 g/m2) WC, External fire (161, 11.8 g/m2)
Sample Result 4 – Climate Change PRCP*TEMP: PRCP(-1,0,+1), TEMP(-1,0,+1), EX: +1-1 (1.2*prcp & -2 of Temp.) 00 +10 -10 +1+1 +1-1 -1+1 -1-1 DBF, Const. CO2
Climate Scenario 1.2P 0.8P 1.2P(+2T) 1.2P(-2T) 0.8P(+2T) 0.8P(-2T)
Future consideration • Model Initialization Spin-up run: • initialize soil and vegetation variable at balanced equilibrium condition • time consuming process as number of gridcells increase Extrapolation from satellite measurement: • satellite-driven LAI initialize vegetation carbon variables using allometry rules (Landsat & MODIS in watershed and regional scale) • Replace model phenology with RS phenology (ex. MODIS)
Grass PSN (gC m-2 d-1) yearday Reinitialize using satellite-driven LAI + allometry from spin-up simulation MOD17: daily PSN (MOD17A2) BGC: daily PSN with spin-up simulation MOD15-BGC: daily PSN using input LAI from MOD15
Warm (13.3 oC) Cool (6.2 oC)
Model Overview Soil temperature model Spatially-explicit estimations Field sampling & measurement RS DEM Meteorological Data Soil Data 1.Respiration 2.Temperature 3.Water content 4.SOM Field LAI NDVI Meteorological Models 1.Air temperature 2.Precipitation 3.Solar radiation 4.Vapor pressure deficit LAI-NDVI model Soil moisture model Soil respiration model
LAI model LAI model LAI-NDVI model Leaf emergency (Je) (Ta-5oC) > 88oC Maximum LAI (Jm) (Aug. 15 in this study) End of litterfall (Jb) (Ta-10oC) < -150oC
NDVI (Landsat TM, August, 1991) Mean 0.55 STDEV 0.13 (solid dots are locations where LAI was measured.)
LAI-NDVI model Landsat TM image in Aug. 1991 LAI measured in Aug. 1998 and 1999 using LI-COR 2000
LAI-NDVI Model : Leaf Emergence and Expand 120 (0~3.8 m2 m-2) 125 130 135 140 145