Download
1 / 35
350 likes | 602 Vues
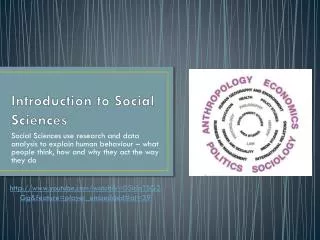
INTRODUCTION TO THE SOCIAL SCIENCES. Social Sciences and Inquiry. 5 WAYS OF KNOWING. Personal Experience We learn from experience –often the hard way! Tradition “Everyone knows” it to be true- we accept what has always been believed Authority Experts tell us that something is true.

E N D
INTRODUCTION TO THE SOCIAL SCIENCES Social Sciences and Inquiry
5 WAYS OF KNOWING • Personal Experience • We learn from experience –often the hard way! • Tradition • “Everyone knows” it to be true- we accept what has always been believed • Authority • Experts tell us that something is true. • Religion • We accept the truths that religious officials/ theology provides • Science • Controlled, systematic observation- all statements are tested and open to public inspection
5 WAYS OF KNOWING • Q: What difficulties are present when using the first 4 ways of knowing together information? • It’s hard to resolve disagreements when people have different experiences, different religious view • Q: How do scientists resolve such conflicts? • Empirical approach- direct systematic observation • Procedures are organized public and recognized by other scientists • Self-correction – hypotheses- truth changes over time with changes in evidence • Objective- try to ensure biases and values do not affect research
Example: Altruism • BEHAVIOUR INTENDED TO HELP OTHERS AND DONE WITHOUT ANY EXPECTATION OF PERSONAL BENEFIT. • Do you think altruism exists?
Explanatory vs Descriptive Studies • Descriptive studies attempt to describe a social reality or provide facts about a group, practice or event • They are designed to find out what is happening to whom, where and when • What percentage of people would return a lost wallet or help a stranger in trouble? • Canada census is a good example
Explanatory vs Descriptive Studies • Explanatory Studies attempt to explain relationships and to provide information on why certain events do or do not occur • Why are some people more likely than others to offer help? • Why do some countries rely on voluntary blood donations while others pay donors?
Inductive vs Deductive Approaches • Deductive Approach - the researcher begins with a theory and uses research to test the theory • Follows the scientific model of inquiry • You might use a survey or experiment Ex: Propose a theory about causes of altruism Experiment or survey – who is most likely to help, men or women?
Inductive vs Deductive Approaches • Inductive Approach - the researcher collects information or data and then generates theories based upon the analysis of that data Ex: Gather and analyze (at the same time) data related to helping behavior Generate theories based upon the data
Astronomy/The Modern View of the Cosmos http://en.wikibooks.org/wiki/Astronomy/The_Modern_View_of_the_Cosmos last updated 18 June 2006
QUANTITATIVE RESEARCH • The goal is scientific objectivity and the focus is on data that can be measured numerically • Deals with a large number of cases • Follows specific procedures and steps to gather and analyze data
QUALITATIVE RESEARCH • Words are used rather than statistics to analyze meanings and patterns in social relationships • Deals with a smaller number of cases • Provides a more detailed picture of a social phenomenon or problem
Hypotheses • Usually one sentence – no more than two! • Begin with a question: • E.g. Do students who eat breakfast in the morning get better grades? • What is the hypothesis? • E.g. Who gets into more trouble at school – boys or girls? • Come up with your own • Write it down on a piece of paper • Formulate a hypothesis from the question you receive.
Formulating a hypothesis • Rising unemployment has led to more children living in poverty. • Increasing stress in daily life has led to more crime. • Younger teenagers are heavier smokers than older teenagers. • Students who do well in high school are more successful in later life. • Females are better than males at picking up non-verbal communication.
Terms to remember… • Variable - any concept with measurable traits that can change or vary from one person, time situation or society to another • Independent variable – the one you control; causes or determines the dependent variable (race, gender, age, ethnicity) • Dependent variable - depends upon or is caused by the independent variable (can be known as the outcome or effect - ex: women are more likely to be altruistic - the degree of altruism is dependent upon gender)
The Process of Inquiry • Identify a problem • Review previous research • Develop a hypothesis • Gather data • Analyze the data • Draw conclusions
Handout • With a partner, complete the handout.
Class Activity • Using the example of a sociologist trying to understand the link between gambling and poverty, formulate a hypothesis and suggest what he or she might do at each stage of this process of inquiry.
Observation(Field research) • Social life in its natural setting • Qualitative data • Natural / Complete vs. Participant (remain unobtrusive) • Unstructured (general observations) vs Structured (looking for specific data) • “Hawthorne Effect” - when subjects perform differently because they know they are being watched - this is called reactivity.
2) Experiment • Cause-effect relationships • The experimental group is made up of subjects who are exposed to the experimental condition • The control group is made up of subjects who are not exposed to the experimental condition • Drug tests • Example: Obedience to authority - What happens if one person was given direct orders to hurt another human being?
Terms to remember… • Reliability - consistency in results • Validity - the accurate measurement of what is being measured • Analysis - the process by which data is organized so comparisons can be made and conclusions drawn • Replication - the repetition of the investigation in the same way as it was originally conducted
Experiments • Goldberg • Do women tend to perceive other women as less or more competent than men at writing professional articles? • Goldberg had 40 college women evaluate papers written by professional people from six different fields. • Goldberg manipulated the sex of the author (independent variable) of the articles by applying female names to some and male names to others. • Each subject then evaluated the paper regarding the author's competence, persuasiveness, professionalism, etc. (dependent variable) • Results indicated that even though the articles were exactly the same in every respect, if the article bore a man's name, the women consistently rated the article more valuable and the author more competent than if it bore a woman's name. • Milgram Experiment • Zimbardo Experiment • Latané and Darley
3) Case Studies • Repeated observations over a period of time • Jane Goodall study of chimps • Usually involve more than one means of gathering data
Case Study Example • The Up series (documentary films) • Begun in 1963 by Michael Apted • Follows 14 British children from the age of 7 – checks in every 7 years • Children were selected to represent the range of socio-economic backgrounds in Britain at that time • Assumed each child’s social class predetermined their future
4) Surveys • Random sample- subjects are chosen by chance: everyone in the population has the same odds of being selected • Representative sample- subjects are selected from a larger population that has the same characteristics of the total population • usually in question format (Gallop poll)
Survey Example • Schaffer and Lamm, 1987 • Much violence in our society occurs not among strangers but among people known to one another. Is this true of dating couples? • Sent questionnaires to 202 students • Questioned both about direct personal experiences and about violent experiences of people they personally knew (indirect violence).
5) Interviews Detailed information collected and recorded directly by the researcher 6) Historical Analysis Diaries, journals, media, pictures, census data 7) Correlational Study Association between events Spearman’s Rank Correlation
Correlational Study Example • Straus, 1979 • Is attitude linked to behaviour? • If parents have an attitude that violent behavior toward children, such as shoving or spanking, is sometimes necessary, are they more likely to behave toward their children in that manner? • There was a relationship, a positive correlation, between attitude and behavior. • However, the strength of this relationship was influenced by a number of other factors. This relationship was stronger for fathers than it was for mothers. Among fathers the relationship was stronger in low-income families than in high-income families. • The study concludes that consistency between attitude and behavior cannot be taken for granted in a study of family violence. Other factors, such as sex, income and patterns of family interaction modify the relationship.
Which method would you use? • List of Hypotheses • Rising unemployment has led to more children living in poverty. • Increasing stress in daily life has led to more crime. • Younger teenagers are heavier smokers than older teenagers. • Students who do well in high school are more successful in later life. • Females are better than males at picking up non-verbal communication.
Group activity • What are the advantages and disadvantages of each research method?
Working with data • Raw data (has not been processed for meaningful use) • Mean (average) • Median (middle number) • Frequency distribution (tabulation of raw data) • Bar graph
Forming Generalizations • -make sure the data is relevant • -organize the data, create charts, calculate percentages (median, frequency distribution) • -make conclusions (accept or reject hypothesis) • * beware of biases!!! (culture, geography, personal, gender)