Download
1 / 42
420 likes | 589 Vues
Chapter 4 Gathering data. Learn …. How to gather “good” data About Experiments and Observational Studies . Project Considerations. Gathering data Observational or experimental data How to sample. Section 4.1. Should We Experiment or Should we Merely Observe?.

E N D
Chapter 4Gathering data Learn …. • How to gather “good” data • About Experiments and Observational Studies
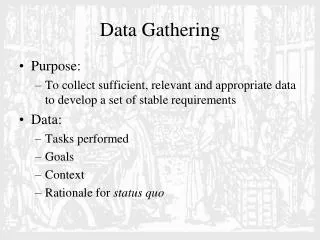
Project Considerations • Gathering data • Observational or experimental data • How to sample
Section 4.1 Should We Experiment or Should we Merely Observe?
Def. review: Population, Sample and Variables • Population: all the subjects of interest • Sample: subset of the population - data is collected on the sample • Response variable: measures the outcome of interest • Explanatory variable: the variable that explains the response variable
Types of Studies • Experiments • Observational Studies
Experiment • A researcher conducts an experiment by assigning subjects to certain experimental conditions and then observing outcomes on the response variable • The experimental conditions, which correspond to assigned values of the explanatory variable, are called treatments
Observational Study • In an observational study, the researcher observes values of the response variable and explanatory variables for the sampled subjects, without anything being done to the subjects (such as imposing a treatment)
Example: Does Drug Testing Reduce Students’ Drug Use? Headline: “Student Drug Testing Not Effective in Reducing Drug Use” Facts about the study: • 76,000 students nationwide • Schools selected for the study included schools that tested for drugs and schools that did not test for drugs • Each student filled out a questionnaire asking about his/her drug use
Example: Does Drug Testing Reduce Students’ Drug Use? • Conclusion: Drug use was similar in schools that tested for drugs and schools that did not test for drugs
Example: Does Drug Testing Reduce Students’ Drug Use? • What were the response and explanatory variables?
Example: Does Drug Testing Reduce Students’ Drug Use? • Was this an observational study or an experiment?
Advantages of Experiments over Observational Studies • We can study the effect of an explanatory variable on a response variable more accurately with an experiment than with an observational study • An experiment reduces the potential for lurking variables to affect the result
Experiments vs Observational Studies • When the goal of a study is to establish cause and effect, an experiment is needed • There are many situations (time constraints, ethical issues,..) in which an experiment is not practical
Good Practices for Using Data • Beware of anecdotal data • Rely on data collected in reputable research studies
Example of a Dataset • General Social Survey (GSS): • Observational Data Base • Tracks opinions and behaviors of the American public • A good example of a sample survey • Gathers information by interviewing a sample of subjects from the U.S. adult population • Provides a snapshot of the population
Section 4.2 What Are Good Ways and Poor Ways to Sample?
Setting Up a Sample Survey • Step 1: Identify the Population • Step 2: Compile a list of subjects in the population from which the sample will be taken. This is called the sampling frame. • Step 3: Specify a method for selecting subjects from the sampling frame. This is called the sampling design.
Random Sampling • Best way of obtaining a representative sample • The sampling frame should give each subject an equal chance of being selected to be in the sample
Simple Random Sampling • A simple random sample of ‘n’ subjects from a population is one in which each possible sample of that size has the same chance of being selected
Example: Sampling Club Officers for a New Orleans Trip • The five offices: President, Vice-President, Secretary, Treasurer and Activity Coordinator • The possible samples are: (P,V) (P,S) (P,T) (P,A) (V,S) (V,T) (V,A) (S,T) (S,A) (T,A)
The possible samples are: (P,V) (P,S) (P,T) (P,A) (V,S) (V,T) (V,A) (S,T) (S,A) (T,A) What are the chances the President and Activity Coordinator are selected? • 1 in 5 • 1 in 10 • 1 in 2
Selecting a Simple Random Sample • Use a Random Number Table (p. 157, A6) • Use a Random Number Generator
Methods of Collecting Data in Sample Surveys • Personal Interview • Telephone Interview • Self-administered Questionnaire
How Accurate Are Results from Surveys with Random Sampling? • Sample surveys are commonly used to estimate population percentages • These estimates include a margin of error
Example: Margin of Error • A survey result states: “The margin of error is plus or minus 3 percentage points” • This means: “It is very likely that the reported sample percentage is no more than 3% lower or 3% higher than the population percentage” • Margin of error is approximately:
Be Wary of Sources of Potential Bias in Sample Surveys • A variety of problems can cause responses from a sample to tend to favor some parts of the population over others
Types of Bias in Sample Surveys • Sampling Bias: occurs from using nonrandom samples or having undercoverage • Nonresponse bias: occurs when some sampled subjects cannot be reached or refuse to participate or fail to answer some questions • Response bias: occurs when the subject gives an incorrect response or the question is misleading
Poor Ways to Sample Convenience Sample: a sample that is easy to obtain • Unlikely to be representative of the population • Severe biases my result due to time and location of the interview and judgment of the interviewer about whom to interview
Poor Ways to Sample Volunteer Sample: most common form of convenience sample • Subjects volunteer for the sample • Volunteers are not representative of the entire population
A Large Sample Does Not Guarantee An Unbiased Sample Warning: Literary Digest Poll example, p. 164
Section 4.3 What Are Good Ways and Poor Ways to Experiment?
An Experiment • Assign each subject (called an experimental unit ) to an experimental condition, called a treatment • Observe the outcome on the response variable • Investigate the association – how the treatment affects the response
Elements of a Good Experiment • Primary treatment of interest • Secondary treatment for comparison • Comparing the primary treatment results to the secondary treatment results help to analyze the effectiveness of the primary treatment
Control Group • Subjects assigned to the secondary treatment are called the control group • The secondary treatment could be a placebo or it could be an actual treatment
Randomization in an Experiment • It is important to randomly assign subjects to the primary treatment and to the secondary (control) treatment • Goals of randomization: • Prevent bias • Balance the groups on variables that you know affect the response • Balance the groups on lurking variables that may be unknown to you
Blinding the Study • Subjects should not know which group they have been assigned to – the primary treatment group or the control group • Data collectors and experimenters should also be blind to treatment information
Example: A Study to Assess Antidepressants for Quitting Smoking Design: • 429 men and women • Subjects had smoked 15 cigarettes or more per day for the previous year • Subjects were highly motivated to quit
Example: A Study to Assess Antidepressants for Quitting Smoking Subjects were randomly assigned to one of two groups: • One group took an antidepressant daily • Second group did not take the antidepressant (this group is called the placebo group)
Example: A Study to Assess Antidepressants for Quitting Smoking • The study ran for one year • At the end of the year, the study observed whether each subject had successfully abstained from smoking or had relapsed
Example: A Study to Assess Antidepressants for Quitting Smoking • Results after 1 year: • Treatment Group: 55.1% were not smoking • Placebo Group: 42.3% were not smoking • Results after 18 months: • Antidepressant Group: 47.7% not smoking • Placebo Group: 37.7% not smoking • Results after 2 years: • Antidepressant Group: 41.6% not smoking • Placebo Group: 40% not smoking
Example: A Study to Assess Antidepressants for Quitting Smoking • Question to Think About: Are the differences between the two groups statistically significant or are these differences due to ordinary variation?