1 / 0

Supply

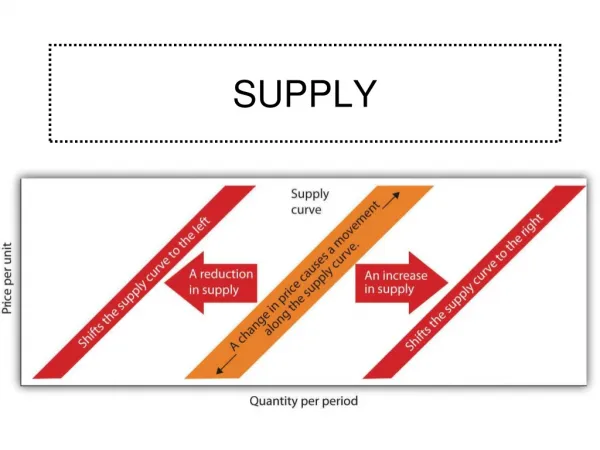
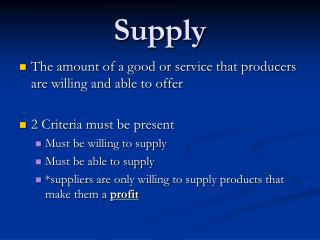
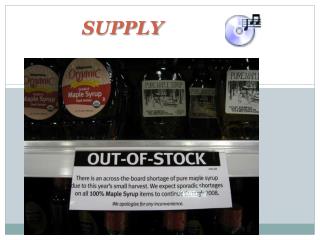
Supply. Chapter 5: Demand. KEY CONCEPT Supply is the willingness and ability of producers to offer goods and services for sale. WHY THE CONCEPT MATTERS

nakia
Télécharger la présentation

Supply

An Image/Link below is provided (as is) to download presentation Download Policy: Content on the Website is provided to you AS IS for your information and personal use and may not be sold / licensed / shared on other websites without getting consent from its author. Content is provided to you AS IS for your information and personal use only. Download presentation by click this link. While downloading, if for some reason you are not able to download a presentation, the publisher may have deleted the file from their server. During download, if you can't get a presentation, the file might be deleted by the publisher.

E N D

Presentation Transcript


  1. Supply
  2. Chapter 5: Demand KEY CONCEPT Supply is the willingness and ability of producers to offer goods and services for sale. WHY THE CONCEPT MATTERS Most people are producers. Doing household chores, working at a job, providing rides to others are ways of producing goods and services. Participating on a team is a way of supplying skills, knowledge, and support to one’s school. Producers incur costs and receive rewards for the work they do.
  3. Section-1 What Is Supply? The Law of Supply KEY CONCEPTS Supply—willingness and ability of producers to offer goods, services Anyone who provides goods or services is a producer Law of supply: — producers willing to sell more of product at higher than at lower price
  4. The Law of Supply EXAMPLE: Price and Supply Smiths sell tomatoes at farmers’ market — willing to offer 24 pounds at standard price of $1 per pound — willing to offer 50 pounds at $2 per pound — willing to offer 10 pounds at 50 cents per pounds — not willing to supply any tomatoes below 50 cents
  5. Supply Schedules KEY CONCEPTS Supply schedule shows — amount of product individual willing, able to offer at each price Market supply schedule shows — amount of product all producers willing, able to offer at each price
  6. Supply Schedules EXAMPLE: Individual Supply Schedule Supply schedule is two-column table — left-hand column lists various prices of a good or service — right-hand column shows quantity supplied at each price
  7. Supply Schedules EXAMPLE: Market Supply Schedule Market supply schedule format similar to supply schedule — quantities supplied are much larger — market quantity supplied also depends on price Market supply schedule format similar to supply schedule — some producers want to learn prices, amount offered by all in market
  8. Supply Curves KEY CONCEPTS Supply curve shows data from supply schedule in graph form Market supply curve shows data from market supply schedule
  9. Supply Curves EXAMPLE: Individual Supply Curve Supply curve is graphic representation of law of supply Supply schedule and curve based on following assumption: — all economic factors except price remain the same
  10. Supply Curves EXAMPLE: Market Supply Curve Market supply curve differs in scope from individual supply curve — both constructed same way Supply curves for all types of producers follow law of supply — will provide more at higher prices although costs more to produce more — reason: higher prices signal potential for higher profits
  11. Reviewing Key Concepts Explain the differences between the terms in each of these pairs: supply and law of supply supply schedule and supply curve market supply schedule and market supply curve
  12. Section-2 What Are the Costs of Production? Labor Affects Production KEY CONCEPTS Marginal product—change in total output caused by adding one worker Specialization—having a worker focus on one aspect of production
  13. Labor Affects Production EXAMPLE: Marginal Product Schedule Marginal product schedule—relation between labor, marginal product Increasing returns—new workers cause marginal product increase Diminishing returns—total output grows at decreasing rate Negative returns—output decreases through crowding, disorganization
  14. Production Costs KEY CONCEPTS Fixed costs—expenses owners incur no matter how much they produce Variable costs—expenses that vary as level of output changes Total cost—the sum of fixed and variable costs Marginal cost—additional cost of making one more unit of the product
  15. Production Costs EXAMPLE: Fixed and Variable Costs Fixed costs: mortgage, insurance, manager salaries, machinery Variable costs: workers’ wages, electricity, materials, shipping — the more a business produces, the more variable costs increase — cutting back hours or workers, vacation closings decrease costs
  16. Production Costs EXAMPLE: Production Costs Schedule Fixed costs remain the same no matter what total product amounts to Calculating marginal cost: — divide change in total cost by change in total product Diminishing returns result in increase in marginal cost
  17. Earning the Highest Profit KEY CONCEPTS Marginal revenue—money made from sale of each additional unit sold — same as price Total revenue—income from selling a product — Total revenue = P (price) x Q (quantity purchased at that price)
  18. Earning the Highest Profit EXAMPLE: Production Costs and Revenues Schedule To make most profit, owner decides number workers hired, units made To decide, owner performs marginal analysis — comparison of costs, benefits of adding a worker, making another unit Profit-maximizing output—level of production yielding highest profit — marginal cost and marginal revenue are equal
  19. Reviewing Key Concepts Explain the differences between the terms in each of these pairs: marginal product and profit-maximizing output increasing returns and diminishing returns fixed cost and variable cost
  20. Section-3 What Factors Affect Supply? Changes in Quantity Supplied KEY CONCEPTS Change in quantity supplied: — rise or fall in amount offered for sale because of change in price Different points on supply curve show change in quantity supplied
  21. Changes in Quantity Supplied EXAMPLE: Changes Along a Supply Curve Change in quantity supplied does not shift the supply curve — movement to right means increase in price and quantity supplied — movement to left means decrease in price and quantity supplied Market supply curves show larger changes than individual curves
  22. Changes in Supply KEY CONCEPTS Change in supply—producers offer different amounts at every price As production costs rise, supply drops; as costs drop, supply rises Change in supply shifts the supply curve Six factors cause change in supply — input costs, labor productivity, technology, government action, producer expectations, number of producers
  23. Changes in Supply Factor 1: Input Costs Input costs—price of resources needed to produce good or service — if price of resource increases, costs increase — if price of resource decreases, costs decrease
  24. Changes in Supply Factor 2: Labor Productivity Labor productivity—amount of product worker can produce in set time Rise in productivity lowers production costs; supply increases Specialization can allow producer to make more goods at lower cost Better-trained workers produce more in less time; decrease costs
  25. Changes in Supply Factor 3: Technology Technology—use of scientific methods, discoveries in production — results in new products or manufacturing techniques Manufacturers use technology to make goods more efficiently Technology enables workers to be more productive
  26. Changes in Supply Factor 4: Government Action Excise tax—tax on production or sale of specific good or service — often placed on items that government wants to discourage use of — taxes increase producers’ costs; decrease supply Regulation—set of rules, laws designed to control business behavior — examples: banning use of certain resources, worker safety laws
  27. Changes in Supply Factor 5: Producer Expectations Producers have expectations about future price of their product — expectations affect how much they will supply at present Expectations of higher price in future may lead to different actions — Farmer may withhold part of current crop and decrease supply — Manufacturer may buy more equipment to increase future supply
  28. Changes in Supply Factor 6: Number of Producers When one producer has successful new idea, others enter the market — supply of good or service increases Increase in number of producers leads to increased competition — may drive less-efficient producers out of market
  29. Robert Johnson: Supplying African-American Entertainment EXAMPLE: Expanding the Number of Producers Johnson recognized cable TV industry ignored African-American market 1980, launched Black Entertainment Television: music, public affairs Cable operators in U.S., Canada, Caribbean began to buy BET’s shows Started BET.com—number one Internet portal for African Americans In 2001, Johnson sold BET, became first black billionaire
  30. Reviewing Key Concepts Explain the differences between the terms in each of these pairs: change in quantity supplied and change in supply input costs and technology excise tax and regulation
  31. Section-4 What Is Elasticity of Supply? Elasticity of Supply KEY CONCEPTS Elasticity of supply—measures producer response to price changes Elastic—price change leads to larger change in quantity supplied Inelastic—price change leads to smaller change in quantity supplied Unit elastic—price and quantity supplied change by same percentage
  32. Elasticity of Supply EXAMPLE: Elastic Supply As product gains popularity, shortage develops, price goes up Producers can increase supply if — resources are easy to come by, inexpensive — production uncomplicated, easy to increase
  33. Elasticity of Supply EXAMPLE: Inelastic Supply Producers can increase supply if — availability of resources limited — production capacity cannot be increased — shipping too costly or unavailable
  34. What Affects Elasticity of Supply? KEY CONCEPTS Main factor determining elasticity is ease of changing production — given enough time, elasticity rises for most goods and services Industries that respond quickly to rising or falling prices: — do not need much capital, skilled labor, hard-to-obtain resources Other industries need a lot of time to shift resources
  35. Reviewing Key Concepts Use each of the terms in a sentence that gives an example of how the term relates to supply: elastic inelastic elasticity of supply
  36. Case Study: Robots—Technology Increases Supply Background Robots—machines that can be programmed to perform a variety of tasks—perform numerous functions in industry. Half of all industrial robots are used in the automobile industry. Robots are ideal for lifting heavy objects and doing repetitive tasks humans find boring but can perform more refined tasks as well. What’s the Issue? How does technology increase supply?
  37. Case Study: Robots—Technology Increases Supply {continued} Thinking Economically Which of the six factors that can cause a change in supply is highlighted in the three documents? Does this factor generally increase or decrease supply? Which document, B or C, addresses the issue of elasticity? Explain. In which article, A or C, are the robots an example of variable costs? Why?
  38. Print Slide Show On the File menu, select Print In the pop-up menu, select Microsoft PowerPointIf the dialog box does not include this pop-up, continue to step 4 In the Print what box, choose the presentation format you want to print: slides, notes, handouts, or outline Click the Printbutton to print the PowerPoint presentation
More Related