Download
1 / 23
230 likes | 421 Vues
Monitoring and reporting project status Chapter 10, pages 317-342. CSSE 372 20.Oct.2008. Outline. Control vs. risk Other kinds of reporting EV. Why do we need to monitor progress?. 70% of projects are: Over budget Behind schedule

E N D
Monitoring and reporting project statusChapter 10, pages 317-342 CSSE 372 20.Oct.2008
Outline • Control vs. risk • Other kinds of reporting • EV
Why do we need to monitor progress? • 70% of projects are: • Over budget • Behind schedule • 52% of all projects finish at 189% of their initial budget • Average of 16% of SW projects are on-time and budget Source: The Standish Group
How and What to Update? • Determine a set period of time and day of week • Report actual work accomplished during this period • Report start and finish dates • Report days of duration accomplished and remaining • Report resource effort • Report percent complete
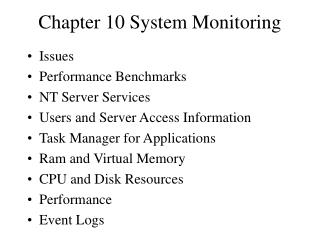
Types of progress reporting • Current period reports • Cumulative reports • Exception reports • Stoplight reports • Variance reports • Numerical • Graphical
EVA • Earned Value Analysis (EVA) is: • an industry standard way to: • measure a project’s progress, • forecast its completion date and final cost, and • provide schedule and budget variances along the way.
Let’s talk terms • BCWS - Budgeted Cost of Work Scheduled • ACWP - Actual Cost of Work Performed • BCWP - Budgeted Cost of Work Performed
Variance (EV – PV) • Positive • Indicates ahead of schedule or less cost than planned • May not always be good • Negative • Indicates behind schedule or more cost than planned • May not always be bad
Full story http://evm.nasa.gov/images/key_data.gif
Performance indices • Schedule Performance Index • SPI = BCWP/ BCWS • Cost Performance Index • CPI = BCWP/ ACWP
Let’s do an example… PROJECT STATUS: Make 1000 widgets over 50 days (20 per day) INPUT: Total Expected Output = 1000 INPUT: Budgeted Unit Cost = $.50 Total Project Budget is 1000 x $.50 = $500. http://www.earnedvalueanalysis.com/index.cfm?nextpage=example
EV Input BCWS: How much did we expect to pay for the work that was scheduled? Total Project Days = 10 Unit Production Per Day = 20 widgets/day Budgeted Unit Cost = $.50/widget BCWS = 10 days x 20 widgets/day x $.50/widget budget = $100
EV Input BCWP: How much did we expect to pay for the work that was actually done? Actual Current Output = 150 Budgeted Unit Cost = $.50/widget BCWP = 150 widgets x $.50/widget budgeted = $75
EV Input ACWP: What was the actual cost of the work that was completed? Actual Current Output = 150 Actual Unit Cost = $.60/widget ACWP = 150 widgets x $.60/widget actual = $90
EV Analysis SV: Schedule Variance = BCWP – BCWS The Question: Are we ahead or behind production schedule? SV = BCWP – BCWS = $75 - $100 = -$25
EV Analysis SPI: Schedule Performance Index = BCWP/BCWS The Question: How far ahead or behind schedule are we? SPI = BCWP/BCWS = 75/100 = 0.75 (LT 1, so behind schedule)
EV Analysis CV: Cost Variance is measured as follows: If BCWP > ACWP, the project is UNDER budget! If BCWP < ACWP, the project is OVER budget! The Question: Are we on or off budget? CV = BCWP - ACWP = $75 - $90 = -$15 (negative means over budget)
EV Analysis CPI: Cost Performance Index The Question: How far on or off budget are we? CPI = BCWP / ACWP = 75/90 = 0.8333 (less than 1 means over budget)
Project forecast EAC: Estimate at Completion Method 1: BCWP at a point + Estimates to completion. Method 2: The ratio of BAC / CPI. Method 3: (Wilkens) [(BAC - BCWP)/CPI] + ACWP The Question: At the rate going, how much will all of this cost? This is a SIMPLIFIED estimate of EAC EAC = BAC / CPI = $500 / 0.8333 = $600