Download
1 / 125
1.27k likes | 1.58k Vues
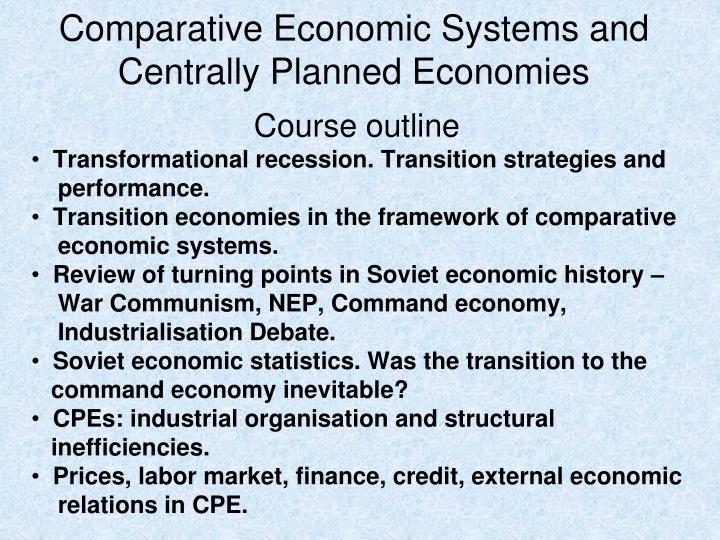
Comparative Economic Systems and Centrally Planned Economies. Course outline Transformational recession. Transition strategies and performance. Transition economies in the framework of comparative economic systems. Review of turning points in Soviet economic history –

E N D
Comparative Economic Systems and Centrally Planned Economies Course outline Transformational recession. Transition strategies and performance. Transition economies in the framework of comparative economic systems. Review of turning points in Soviet economic history – War Communism, NEP, Command economy, Industrialisation Debate. Soviet economic statistics. Was the transition to the command economy inevitable? CPEs: industrial organisation and structural inefficiencies. Prices, labor market, finance, credit, external economic relations in CPE.
Shock therapy vs. gradualism. Transformational recession • Economic performance of transition economies • Shock therapy and gradualism • Theory of transformational recession; growth theory in transition economies • Distortions in industrial structure and trade patterns • Institutions, rule of law and democracy
Economic performance of transition economies • Almost all transition economies have experienced a recession associated with reforms • Exceptions: China and Vietnam
Table . Changes in life expectancy at birth in 16 transitional economies of Europe, 1989-2000 Source: Cornia (2004) - MONEE database (www.unicef-icdc.org)
VIOLENCE: increase in crime and murder rates RUSSIA: by the mid 1990s the murder rate was over 30 people per 100,000 of inhabitants 1-2 persons in Western and Eastern Europe, Canada, China, Japan, Mauritius and Israel; Only two countries in the world had higher murder rates – South Africa and Colombia; In Brazil or Mexico this rate is two times lower; The US murder rate, the highest in developed world – 6-7 people per 100,000 of inhabitants – pales in comparison with the Russian one.
Table. Number of deaths from external causes per 100,000 inhabitants in 2002 – countries with highest rates *Deaths due to unidentified external causes, wars, police operations, executions. Totals may differ slightly from the sum of components due to rounding. Source: WHO (http://www.who.int/entity/healthinfo/statistics/bodgbddeathdalyestimates.xls)
Increase in income inequalities in transition economies (source: Milanovic, 1998)
Transformational recession • In Central Europe recession lasted for 2-3 years (as during the Great Depression!), output declined by 20-30%; pre-reform level of output was reached after 10 years of transition • In CIS recession lasted for 5-10 years, output declined by about 50%; pre-reform level is expected to be reached after 15-25 years of transition (in Russia - 2009)
Shock therapy: radical reforms and rapid transformation Examples: Vietnam, East European (especially Central European countries and Baltic states Gradualism: step by step approach to economic transformation Examples: China, Russia (1987-91), Hungary (before 1991) Shock therapy vs. gradualism
Shock therapy: features • Instant deregulation of prices; introduction of convertibility of national currency • Macroeconomic stabilization (bringing down inflation to less than than 40% a year in 6 months) • Cut subsidies from 10-15% GDP to 2-3% GDP during 1-2 years • Privatization of 50% property during 2-3 years
Shock therapy: arguments • Rapid liberalization allows to avoid painful and costly period, when the old centrally planned economy (CPE) is not working already, while the new market one is not working yet. - “One cannot cross the abyss in two jumps” • Fast liberalization ensures irreversibility of reforms ================================== East European countries and Baltic states were fast liberalizers and successful stabilizers, while their CIS counterparts were doing much worse
Gradualism: arguments • Protection of property rights is essential for growth; privatization creates uncertainty with property rights; institutional vacuum may have a devastating impact on output • Resources need to be re-allocated from non-competitive to competitive sectors, which may take considerable time • For senior citizens even a temporary decline in real incomes is not acceptable; guarantees for transfers are needed ============================= Chinese strategies of “dual track price system” and “growing out of socialism” proved to be successful
Magnitude of recession: conventional explanation • Number of studies undertaken to prove that fast liberalization and macro-stabilization pays off and leads to better performance • Conventional wisdom summarized in the 1996 World Development Report From Plan to Market: differences in economic performance were associated mostly with "good and bad" policies, in particular with the progress in liberalization and macroeconomic stabilization: • “Consistent policies, combining liberalization of markets, trade, and new business entry with reasonable price stability, can achieve a great deal even in countries lacking clear property rights and strong market institutions” (WDR 1996, p. 142)
Magnitude of recession: conventional explanation (from the article of A. Illarionov – economic adviser to the president of Russia in 2000-2005) • Low growth rates of money supply => high growth of output
Magnitude of recession: conventional explanation • Low rates of inflation => high growth of output
Magnitude of recession: conventional explanation • Low share of state sector in output => high growth of output
Magnitude of recession: conventional explanation • Low share of government spending in GDP => high growth of output
Magnitude of recession: conventional explanation • Low taxes on export and import => high growth of output
Magnitude of recession: conventional explanation The secret of high growth – low inflation, small state, open economy
Magnitude of recession: conventional explanationLiberalization indices from EBRD
Magnitude of recession: conventional explanation- greater liberalization=> better performance
Magnitude of recession: conventional explanation- greater liberalization=> better performance
Magnitude of recession: conventional explanation - lower inflation => better performance
Does liberalization matter? • Vietnam and China are similar in initial conditions and in transition results (immediate growth of output without transformational recession) despite different reform strategies: • Chinese reforms are the classical example of gradualism • Vietnamese reformers introduced shock therapy treatment (instant deregulation of most prices and introduction of convertibility of dong) in 1989 • Differing performance of the former Soviet Union (FSU) states: • Baltic states are the champions of liberalization and stabilization in the region. In the Baltic output fell in the early 1990s by 36-60% and even in 1996, two years after the bottom of the recession was reached, was still 31% to 58% below the pre-recession maximum. • Uzbekistan is commonly perceived to be one of the worst procrastinators. However in Uzbekistan the reduction of output in 1990-95 totaled only 18% and the economy started to grow again in 1996 • In 2005 the highest GDP as a % of 1989 was in Uzbekistan, Belarus, Kazakhstan, Estonia, Turkmenistan, Azerbaijan (all, except Estonia, are not fast reformers)
Indices of economic freedom and GDP growth in Russia and China
Positive relationship between liberalization and performance is just the result of the difference in the magnitude of the recession in EE countries, as a group, and FSU states, also as a group
Russia was leading in economic liberalization, while Belarus was lagging
But Belarus and Uzbekistan are doing better (even though they are net importers of fuel), not to mention net exporters like Azerbaijan, Kazakhstan, Turkmenistan
Russian growth is lagging behind that of oil exporters and some oil importers
Explaining the magnitude of recession • Transformational recession is viewed as a structural adjustment process resulting from the need to overcome disproportions inherited from the centrally planned economy: • high defense expenditure; • over-industrialization and underdevelopment of the service sector; • external trade distortions: "under-openness" of the economy, the perverse structure of trade among former Soviet republics and among socialist countries; • micro-level distortions (e.g. associated with the size and specialization of enterprises).
Adverse supply shock: deterioration of terms of trade in non-resource industries
High defense expenditure and fall in output resulting from conversion: weak correlation, excluding the outliers
Distortions were measured as deviations in the shares of industry, agriculture and services in GDP, as compared to "normal" structure, defined as an average industrial structure for market economies with similar levels of per capita GDP
Distortions in industrial structure and external trade and GDP change in 1989-96