Download
1 / 34
340 likes | 503 Vues
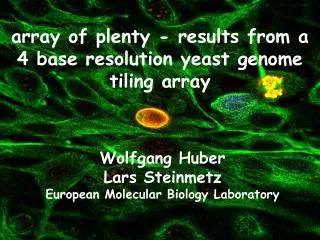
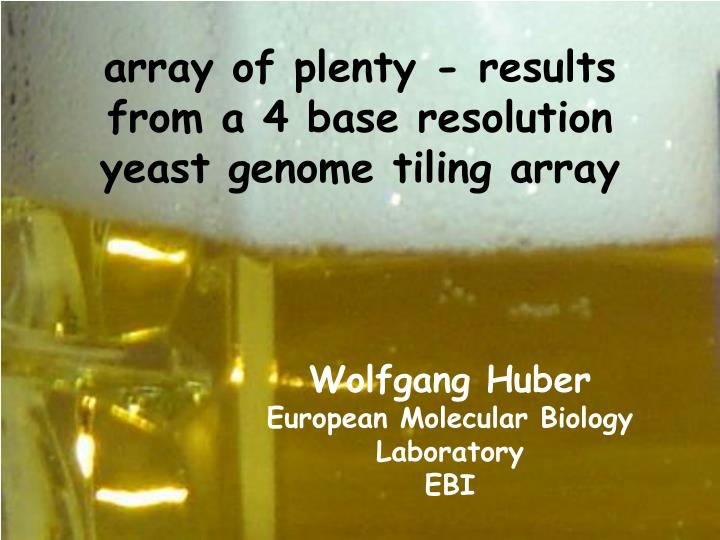
array of plenty - results from a 4 base resolution yeast genome tiling array. Wolfgang Huber European Molecular Biology Laboratory EBI. Bioinformatics and Computational Biology Solutions Using R and Bioconductor, R. Gentleman, V. Carey, W. Huber, R. Irizarry, S. Dudoit. Springer (Aug. 2005).

E N D
array of plenty - results from a 4 base resolution yeast genome tiling array Wolfgang Huber European Molecular Biology Laboratory EBI
Bioinformatics and Computational Biology Solutions Using R and Bioconductor, R. Gentleman, V. Carey, W. Huber, R. Irizarry, S. Dudoit. Springer (Aug. 2005) Topics: microarray analysis (meta)data integration machine learning graphs: for data, knowledge, & models
Bioconductor Core design: Robert Gentleman, Rafael Irizarry, Vince Carey, WH. Release 1.6 contained 124 packages, current number is 140 Ca. 15,000 downloads from main website after each release. June 2005: 9009 unique visitors User poll by Affymetrix: Bioconductor is 2nd-most popular third-party software… after MS-Excel.
Genechip S. cerevisiae Tiling Array 4 bp tiling path over complete genome (12 Mio basepairs, 16 chromosomes) Sense and Antisense strands 6.5·106 oligonucleotides 5 mm feature size Chips manufactured by Affymetrix Application + analysis by L. Steinmetz (EMBL/Stanford Genome Center) and W. Huber (EMBL/EBI)
Samples Genomic DNA Poly-A RNA (double enriched) from exponential growth in rich media Total RNA from exponential growth in rich media 3 replicates each
before Probe specific response normalization after
Probe specific response normali-zation remove ‘dead’ probes
Segmentation Two obvious options: Smoothing and thresholding: simple, but estimates of transcript boundaries will be biasedand depend on expression level Hidden Markov Model (HMM): but our “states” come from a continuum! Fiddly. Our solution: Fit a piecewise constant function change point
The model t1,…, tS: change points Y: normalized intensities x: genomic coordinates mk: level of k-th segment
Model fitting Minimize t1,…, tS: change points J: number of replicate arrays Complexity O(n2) through dynamical programming algorithm. F. Picard et al., BMC Bioinformatics 6 (2005) Bai+Perron, Journal of Applied Econometrics (2003)
Novel Transcripts Potential antisense regulator
Expressed Features 5646 ORFs with ≥ 7 probes 5306 (94%) above background in poly-A RNA 5192 (92%) in total RNA (FDR=0.001) untranscribed: meiosis, sporulation poly-A RNA: 9356k of 11360k (82.4%) total RNA: 8786k (77.2%) Both: 9612k (84.3%) … of which not annotated: 1559k (13.7%) annotated total: 8997k of 12071k (74.5%) Fraction of transcribed basepairs
Novel transcripts Basis: multiple alignment of 4 yeast genomes: S.cerevisiae, S.bayanus, S.mikatae, S.paradoxus. Kellis et al. Nature (2003) Conservation analysis: fraction of segments for which there is a multiple alignment; total tree length Codon signature: 3-periodicity of mutation frequencies novel transcribed segments untranscribed << annotated transcripts. with Lee Bofkin, Nick Goldman
Antisense transcripts • microtubule-mediated nuclear migration • cell separation during cytokinesis • cell wall • single-stranded RNA binding (all 5: NAB2, NAB3, NPL3, PAB1, SGN1) • (p<2x10-16)
Conclusions o Conventional microarrays: measure transcript levels o High resolution tiling arrays: also transcript structure introns, exons, alternative transcription start sites partial degradation novel transcripts new annotation o Probe-response normalization: make signal comparable across probes – and hence across genes! o Simple segmentation algorithm: well-developed theory, accurate estimation of change-points, including confidence intervals o Software - from Bioconductor (also: CEL file import, normalization, further statistical testing)
Acknowledgements Group Oleg Sklyar Jörn Tödling Matt Ritchie Florian Hahne Raeka Aiyar Ligia Bras Tiling Array Project Lars Steinmetz, Lior David, Marina Granovskaia, Lee Bofkin, Nick Goldman, Jörn Tödling Joint Projects Lars Steinmetz, EMBL HD, yeast transcriptomics & high-density tiling array Michael Boutros, DKFZ, genetic interactions & HT-RNAi Robert Gentleman, FHCRC Seattle, Bioconductor Silke Sperling, MPI MG Berlin, heart development and ChIP-chip Eileen Furlong, EMBL HD, muscle development and ChIP-chip Alvis Brazma, EMBL EBI, microarray quality metrics Funding HFSP, EU, MRC, LGC / DTI, NGFN / BMBF
Probe-specific response normalization si probe-sequence specific response factor. Estimation: geometric mean of intensities from DNA hybridization bi =b(si ) probe-sequence specific background. Estimation: for strata of probes with similar si, estimate b through location estimator of distribution of intergenic probes, then interpolate to obtain continuous b(s)
Defining Expressed Transcripts Segments not overlapping any annotated features Segments overlapping annotated features Normal distribution
Model selection criteria model family has just one parameter: no. of segments
Confidence Intervals Di level difference Qi no. data points / unit t Wi error variance (allowing serial correlations) true and estimated change points Vi(s) appropriately scaled and shifted Wiener process (Brownian motion) Bai and Perron, J. Appl. Econometrics 18 (2003)
Segments Statistics Annotated 100% overlap Annotated >50% overlap Novel isolated - filtered Novel isolated - unassigned Novel antisense - filtered Novel antisense - unassigned length level