Download
1 / 13
140 likes | 255 Vues
CONTROLLING EPIDEMICS IN WIRELESS NETWORKS. Ranjan Pal 1 Ayan Nandy 2 Satya Ardhy Wardana 3 Neeli Rashmi Prasad 3 Ramjee Prasad 3 1 University of Southern California, USA 2 Indian Institute of Technology, Kharagpur, India 3 Center for TeleInfrastruktur (CTIF), Aalborg University, Denmark.

E N D
CONTROLLING EPIDEMICSIN WIRELESS NETWORKS Ranjan Pal1 Ayan Nandy2 Satya Ardhy Wardana3 Neeli Rashmi Prasad3 Ramjee Prasad3 1University of Southern California, USA 2Indian Institute of Technology, Kharagpur, India 3Center for TeleInfrastruktur (CTIF), Aalborg University, Denmark
OUTLINE • Introduction • Probem Definition • Network Model • Strategy Selection Algorithm • Conclusion
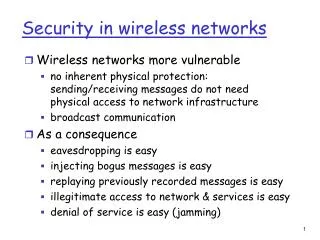
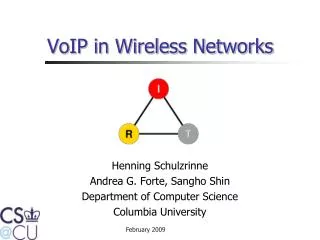
INTRODUCTION • Modern day wireless communications is witnessing the emergence of various viruses that can spread over air interfaces. • Several application scenarios in multi-hop wireless networks require many nodes to cooperate on a single application. Wireless Sensor Network Social Network • Viruses can spread over the air quickly from device to device and devastate the entire network in a short period of time causing an EPIDEMIC
PROBLEM DEFINITION • We propose a novel method using spectral properties of graphs to select the best suited epidemic control strategy for a wireless network from a pool of strategies. • Our methodology will provide a general framework for good, structured, centralized strategy selection for epidemic control in static multihop wireless networks.
NETWORK MODEL • Multi-hop network • Undirected • Single channel, single radio per node • Network represented by a graph G = (V,E) • Links (u,v) and (v,u) are different • V represents the set of nodes and E is the set of wireless data links u v 5
EXAMPLE OF LAPLACIAN MATRIX OF A GRAPH Spectral function of the network graph the eigenvalues of the Laplacian of a graph Centrality of its vertices
NETWORK MODEL We term thisgraph as a parent graph. Spread Graph - Initial configuration : a group of independent nodes in 2-D space. - a compromised node spreads its virus to its neighboring nodes after k time units of it being infected. to model the spreading of the virus (evolution) - Monitor the spread graph at certain pre-specified time intervals, then apply our control strategy to the graph at each interval. We assume that it is not possible to monitor the network all the time
STRATEGY SELECTION ALGORITHM • The spectrum of a parent graph G is the set of eigenvalues of its Laplacian matrix L. • A spectral function F of a parent graph G is formed, taking as arguments of the eigenvalues of its Laplacian. • We define our spectral function as the average of all the igenvalues. • The main aim is to be able to decide the best epidemic control strategy from a pool of strategies for a given parent graph. • We classify parent subgraphs into 2 categories (predefined threshold): 1) graphs with low values of F (below the threshold) 2) graphs with high values of F (above the threshold)
STRATEGY SELECTION ALGORITHM • We observe its spread graph over time and apply each of our proposed strategies at certain pre-specified time intervals. • Doing so over, a total inspection period of T will result in ranking the strategies in order of effectiveness of epidemic check. • We then try to see whether there is any strategy that suits best for all the parent graphs in the set with high values of F. • Likewise, we try to find strategies which suit best for all parent graphs in the set with low values of F.
CONCLUSION • We have proposed a spectral graph-theoretic selection algorithm that aims at selecting the best strategy from a pool of strategies, to prevent an epidemic outbreak in a given parent network. • As part of ongoing work, we are performing a detailed simulation study based on our algorithm to come up with a general strategy classification scheme.
STRATEGIES ALGORITHM Strategy 1: Treatment of edges whose end vertices result in maximum sum of degrees. Strategy 2: Treatment of edges whose end vertices result in maximum product of degrees. Strategy 3: Treatment of vertices whose degree is the Maximum. Strategy 4: Treatment of edges whose end vertices result in maximum harmonic product of degrees
STRATEGIES ALGORITHM • A. Functional Properties • One way to comment on the spread of virus in an evolving • spread network is to observe the values of its functional • properties over time. The most common functional property • used is characteristic path length [5]. In this paper we use • a different functional property called harmonic path length, • to track the spread of virus. We define harmonic path length • (HPL) of any graph G as the median of the harmonic means • of the shortest path lengths connecting each vertex in G • to all other vertices. If a vertex in a graph is isolated, it’s • distance from any other vertex in the graph is infinite. The • characteristic path length (CPL) with respect to a vertex is • the average of the shortest distance from that vertex to every • other vertex in the graph. The CPL of the graph is the median • of CPL value over all the vertices. Now, even if one vertex • is isolated, the CPL for each vertex will be infinite. So, the • CPL of the graph will be infinite. In this paper, we will • be mostly dealing with ’evolving’ spread graphs which are • generally sparse/disconnected in nature. To compare between • two different graphs, each having disjoint subgraphs, we need • a different parameter. That is why we use harmonic path length • which comes up with a finite value if at least half the vertices • of the graph are not isolated, else the value is infinite. More • than one graph might have an infinite value. To distinguish • between them, the time when infinity is reached for each, is • an important parameter. The next subsection elaborates this • point. • B. Suitability of Strategies • Functional properties determine the suitability of a particular • strategy. For a particular strategy, an infinite value of HPL • at a time instant indicates that more than half of a spread • network is isolated. This means that the virus has not been • able to substantially percolate in the network. Let Gst be the • spread graph under strategy s at time instant t. If the value • of HPL of Gst at t is infinity and remains so for the interval • [t; T], where T is a large enough total inspection period, the • strategy s under question is said to be successful in epidemic • check. Lesser the value of t, better is the strategy. If t > T • then the strategy under question does not cause the cessation • of virus spread and is considered not that effective. In Figure • 1, we show a typical variation of HPL with time in an example • spread network. The value 200 on the y-axis represents infinity. • The spread of virus is in full effect between time instants • 35 and 175, after which there begins an improvement in the • situation. The virus spread decreases considerably after time • instant 200.