Download
1 / 96
970 likes | 1.25k Vues
Hearing Aids and Quality of Life. Sergei Kochkin, Ph.D. Better Hearing Institute. Sad Truth. The industry (HIA) spent $100,000 on the NCOA Quality of Life Study – a landmark study. The study demonstrated the real value of hearing aids.

E N D
Hearing Aids and Quality of Life Sergei Kochkin, Ph.D. Better Hearing Institute
Sad Truth • The industry (HIA) spent $100,000 on the NCOA Quality of Life Study – a landmark study. The study demonstrated the real value of hearing aids. • No major marketing interventions instituted to leverage these findings by any of the key associations. • Business as usual : • Sluggish growth with naturally growing customer base. • Marketing to an aging customer base our newest technology. • Complacently living off the increased margins from advanced technology versus bringing in new and younger customers.
Agenda • Present executive summary of NCOA Quality of Life study (Ref. 1/2000 Hearing Review) • Some ideas for leveraging the quality of life findings in your practice. • Optimizing the consumer’s experience with hearing aids.
The NCOA Quality of Life Study From Executive Summary: Quantifying the Obvious: The Impact of Hearing Aids on Quality of Life. Kochkin & Rogin, The Hearing Review, January 2000.
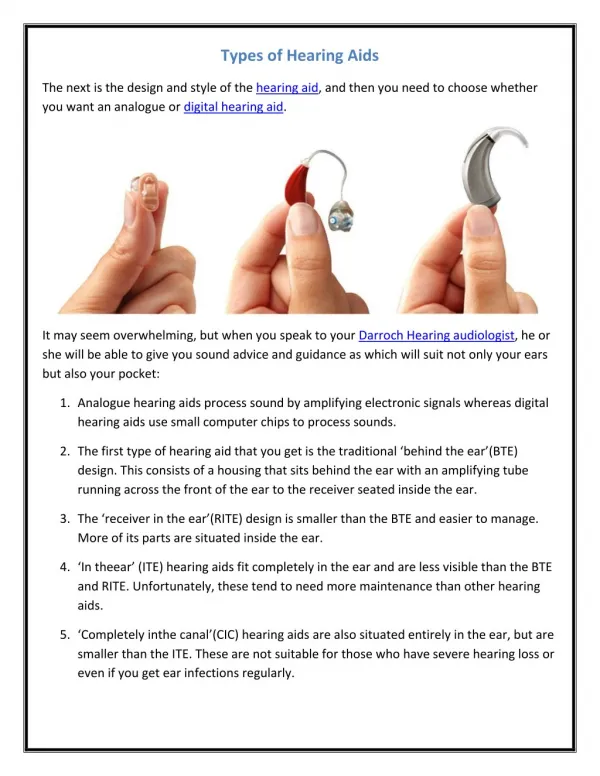
Introduction • The incidence of hearing loss in the U.S. is approximately 10% - 31.5 million • Market growth in U.S. low despite positive demographics and improved technology. • Hearing aids still positioned in market place as for “old people”.
Introduction • Majority of hearing impaired non-owners and their physicians have negative view of hearing aids: • Low value • Poor benefit • Do not perform in noisy situations • Even a few years ago : FDA did not permit “quality of life” claims in U.S. advertising and marketing.
Research Objectives • Assess the impact of aided hearing loss on multiple dimensions of quality of life. • Psychological • Emotional • Social • General health • Family interaction • Life satisfaction
Market Development Objectives • Use the quality of life study to demonstrate “value of hearing aids” to the consumer and medical segments. • Use an independent third party to carry this message to the press: • National Council on Aging (NCOA)
Market Development Objectives • Overall Goals • increase awareness of importance of hearing • show that hearing aids are the treatment of choice • stimulate sales of hearing aids
Method - Knowles MarkeTrak V • National family opinion panel • Hearing loss screening 80,000 households • Balanced to 9 key U.S. census variables • 13,492 hearing-impaired households identified. • Detailed questionnaire 2,720 hearing aid owners (MarkeTrak). • Response rate 83%
Method • HIA commissioned National Council on Aging to conduct quality of life study using MarkeTrak V hearing loss panel. • Seniors Research Group (Michigan) - detail • Knowles Electronics - Executive summary • Large nationally representative sample: • Individuals with hearing loss • Aided and unaided - 1,500 surveyed each • And their significant other (spouse) • Ages 50 and above
Method • Hearing-impaired - 8 page survey • Family member - 4 page survey • Response rate of 79% to mail survey • Match aided and unaided respondents based on a simple screening test. • Frequency distribution of hearing test into quintiles (five groups 20% - 100%). • Cohort analysis within the five hearing loss groups.
Method Screening Instrument • American Academy of Otolaryngology 5 minute hearing test (Revised) • 15 question unidimensional hearing test (principle components factor analysis with eigenvalues set to one) • 5 point Likert scale (Strongly agree to Strongly disagree)
Telephone Multiple speakers Television Background noise Missed calls/doorbell Directionality Ask people to repeat High frequency sounds People mumble Large reverberant rooms People annoyed by misunderstandings Avoid social situations Inappropriate response Family and friend perceptions Strain to hear Method Screening Instrument Items
Method Screening Instrument • Significantly correlated (Koike, Hurst & Wetmore 11/94) with objective hearing loss data: • Pure tone (highest) • Air conduction thresholds • Speech discrimination scores (SDS) • Speech reception thresholds (SRT)
Method Screening Instrument • Modal respondent subjective evaluation of their hearing loss in quintiles based on the five minute test: • Quintile 1 (20%) - Mild/Moderate (=) • Quintile 2 (40%) - Moderate/mild • Quintile 3 (60%) - Moderate/severe • Quintile 4 (80%) - Severe/Moderate (=) • Quintile 5 (100%) - Severe/profound
Analysis • Goal is to discern trends across the five hearing loss groups: aided vs unaided. • Calculate composite scores (e.g. emotional instability) in Z scores with a mean of 5 and standard deviation of 2 (Stanine normal curve method). • e.g. 5=average, 3=16%, 7=84% • Or % scores (e.g. % depressed)
Analysis • Compare for significant differences: • ** 95% or 99% or better confidence level • * 85% or 90% level (trends only especially at Q1 and Q5 where sample sizes are smaller) • Test of significance: • Attitudinal indices: T-test • Percents (%) : Z test for differences in proportions
Final sample sizes Respondents: 1,037 Users : 1,032 Non-users Family members: 873 Users : 837 Non-users
Demographics: Household Income Is Related to Severity Hearing Loss
Demographics • Groups reasonably matched: • Age (slightly older in two “milder hearing loss user groups) • Marital status • Gender • Income (favors 2 user groups) • Employed status (favors 2 non-user groups) • Segmented based on hearing loss as measured by five minute test (quintiles). • No major systemic differences between user & non-user groups.
Results Health Status
Health Status: Overall self-assessment of health and absence of pain
Health Status • Did not find significant differences on specific disease states: • Arthritis • High blood pressure • Heart problems
Results Social & Solitary Activities
Activities • Self-measure of monthly incidence: • Solitary (e.g. reading, TV, hobby) - 6 items • Social (e.g. attend church, organized social events) - 7 items • No significant differences on solitary activities • But, significant differences on social activities.
Activities • 3/5 groups attend senior center more. • Might be related to small age differences between groups. • No systematic significant differences • attendance at church (2/5 user groups) • Sport events (1) • Theatre,movie (0) • Volunteering/civic groups (2) • Shop with family (1)
Results Relationship with Family & Friends
Relationship with Family & Friends • 12 items on interpersonal relationship • “How much can you relax and be yourself around them” (A lot - Not at all) • 12 items on negativity in relationship • “How often do they argue with you” (Often - never) • 5 items on monthly incidence of contact (phone and in person)
Lack of Interpersonal Warmth in Relationships(high scores are worse)
Low negativity in family relationships(e.g. arguments, tenseness, criticism)(High scores are better)
Contacts with friends and family • Found no systematic significant differences on incidence of: • Phone contacts • Meeting in person • Total contacts
Results Social Effects
Social Effects • Stigma (2 items) • Difficulty in Communication (4 items) • Discrimination (4 items) • Rejection (2 items) • Overcompensation for hearing loss (5 items) • Withdrawal (2 items) - family (6 items) • Negative impact on family (6 items) • Family accommodation (3 items)
Social Effects: Stigma“e.g. embarrassment wearing hearing aids”
Social Effects: Overcompensation for hearing loss“e.g. Pretend I understand what people say”
Social Effects: Discrimination“Accused of hearing only what they want to hear”
Social Effects: Difficulty in Communication“e.g. Trying to hear in some situations takes more effort than it’s worth.”
Social Effects: Safety Concerns from Family Members“e.g. Have made mistakes because of hearing loss”
Social Effects: Non-significant variables • Negative effects of hearing loss on family members. • e.g. “I find it exhausting to cope with their needs” • Family accommodation of hearing loss. • e.g. “I have to use signs and gestures a lot of the time” • Withdrawal • e.g. They tend to withdraw from social activities where communication is difficult”