Download
1 / 17
170 likes | 264 Vues
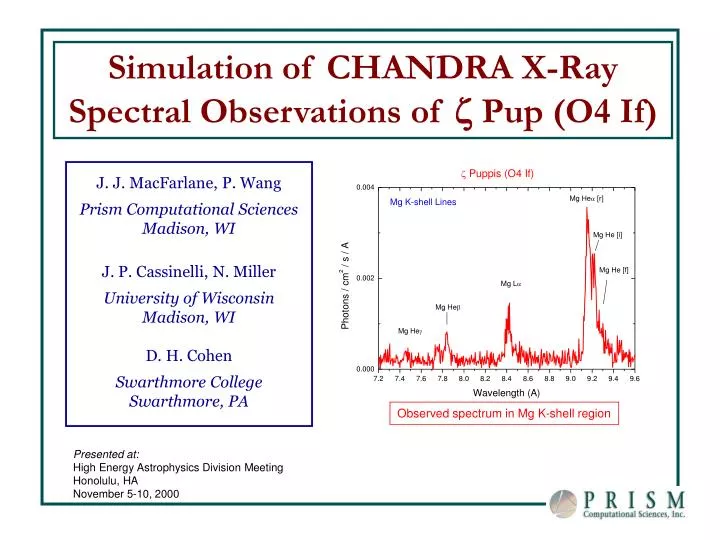
Simulation of CHANDRA X-Ray Spectral Observations of z Pup (O4 If). J. J. MacFarlane, P. Wang Prism Computational Sciences Madison, WI J. P. Cassinelli, N. Miller University of Wisconsin Madison, WI D. H. Cohen Swarthmore College Swarthmore, PA. Observed spectrum in Mg K-shell region.

E N D
Simulation of CHANDRA X-Ray Spectral Observations of z Pup (O4 If) J. J. MacFarlane, P. Wang Prism Computational Sciences Madison, WI J. P. Cassinelli, N. Miller University of Wisconsin Madison, WI D. H. Cohen Swarthmore College Swarthmore, PA Observed spectrum in Mg K-shell region Presented at: High Energy Astrophysics Division Meeting Honolulu, HA November 5-10, 2000
Background • High-luminosity, early-type (O and B) stars have observed X-ray luminosities of Lx ~ 10-7 Lbol. These stars are also known to have high mass loss rates and high-speed outflows. • Observations and theory tend to support the view that the X-rays from OB stars originate from shock-heated plasma within their wind. • X-ray observations1 with Einstein, ROSAT, BBXRT, and ASCA found no evidence of significant attenuation of soft X-rays by an overlying wind. Such attenuation would be expected if the X-rays originate in a corona. • Numerical simulations of radiatively-driven winds2 suggest that the winds are unstable and form strong shocks. • Wind ionization simulations3 for z Pup with an embedded X-ray source indicate that the observed O VI UV P-Cygni profile -- which originates due to inner-shell photoionization of the O IV in the wind -- is consistent with a wind-embedded X-ray source, and that a significant fraction of the X-rays originate withinr ~ 3 R*. • High spectral resolution observations of O and B stars provide important information on the conditions and location of the X-ray-emitting plasma. 1 Cassinelli et al.; Hillier et al.; Corcoran et al. 2 Owocki et al.; Cooper et al.; Feldmeier et al. 3 MacFarlane et al.
CHANDRA Spectra for z Pup Show Strong Emission from K-Shell Lines of N, O, Ne, Mg, Si, and S and L-Shell Lines of Fe. • z Pup HETG/METG spectra show bright line emission from 5 Å to 26 Å.
Detailed Examination of z Pup Emission Line Spectra Can Help Provide Constraints on Plasma Conditions and Location of X-ray Source • As an example, Mg K-shell spectrum from 7 Å to 10 Å (plot at left) shows: • He-like Hea, Heb, and Heg lines • He intercombination and forbidden lines • H-like La line. • Plot at right shows He-like “f-i-r” complex • Resonance (r): 1s2p 1P1 1s21S0 (l = 9.17 Å) • Intercombination (i): 1s2p 3P1 1s21S0 (l = 9.23 Å) • Forbidden (f): 1s2s 3S1 1s21S0 (l = 9.32 Å)
He-Like “f-i-r” Lines Are Seen in the CHANDRA Spectrum of z Pup. 1s2p 1P1 • Primary atomic processes affecting f-i-r lines: • Electron-impact excitation from the ground state populates the n = 2 states. • 2 1P state (r) spontaneously decays to g.s. (fast). • 2 3P state (i) also radiatively decays to g.s. • [In laboratory plasmas, the intercombination-to-resonance line ratio is often a useful density diagnostic.] • The population fraction for the 2 3S state (f) can be relatively high because processes which de-populate it are slow. • In the absence of a radiation field, the 2 3S state collisionally depopulates to the 2 3P states, and is a useful density diagnostic. • However, for O stars, the photoexcitation rate (due to UV photospheric radiation) can exceed the collisional rate).1 9.17 Å 1s2p 3P2,1,0 1s2s 1S0 1000 - 1060 Å 9.23 Å 1s2s 3S1 9.32 Å Two-photon decay 1s21S0 Radiative decay Collisional excitation UV-induced Photoexcitation 1 Blumenthal et al. (1972). See also Kahn et al (2000). Energy Level Diagram for He-like Mg
Stellar TR 1-D Collisional-Radiative Simulations Have Been Performed to Analyze CHANDRA Spectrum for Mg and Si • In this work, we focus on the Mg and Si K-shell line emission. • Simulations were performed using a 1-D collisional-radiative code (NLTERT). • -- Populations are determined from state-state solution to atomic rate equations: • dni/dt = - niSkWik + SkinkWik • where the Wik represent atomic rates due to: • -- collisional excitation and deexcitation • -- collisional ionization and recombination • -- spontaneous emission • -- radiative recombination • -- dielectronic recombination • -- photoexcitation • Radiation field model: • -- Assume a diluted Planckian incident at the plasma boundary: • Fv = W(r) Bv(T*) , • where • W(r) = geometric dilution factor • Bv(T*) = Planck function with T* = 42,400 K.
Overview of Collisional-Radiative / Atomic Modeling • Atomic energy level data and most radiative and collisional cross section data were computed using ATBASE. • Forbidden line oscillator strengths were taken from Johnson et al. (1995). • Atomic models for Mg and Si include: • Ionization stages: Be-like through fully ionized. • 76 atomic levels, mostly in the He-like and Li-like ions. • All 1s12s12p1 and 1s2p2 Li-like autoionization levels.
Overview of ATBASE Atomic Physics Package • ATBASE computes atomic data required for simulating the spectral properties and ionization dynamics of astrophysical and laboratory plasmas. It utilizes a suite of atomic structure and modeling codes (Hartree-Fock, Dirac-Fock, Configuration Interaction, Distorted Wave) to compute radiative and collisional data, including: • Atomic energy levels • Oscillator strengths • Photoionization cross-sections • Collisional ionization and excitation cross sections • Autoionization • Dielectronic recombination • The ATBASE database has been used extensively in the analysis from spectra from (non-LTE) laboratory plasmas, and in studies of hot star wind ionization.
CHANDRA Spectra Show that the X-ray Lines Are All Significantly Doppler Broadened • In the absence of enhanced Doppler broadening (i.e., stationary plasmas), simulated spectra (including instrumental broadening) are much narrower than the observed spectra. • Line fits to the data find typical fluid velocities of ~ 800 to 1000 km/sec (see N. Miller, this meeting). • This is consistent with hot plasma being embedded in the high-speed outflows of O star winds.
H-Like to He-like Line Ratios Provide Good Temperature Diagnostics. • La-to-Hea (r) line ratios show a modest density dependence. • La-to-He (f+i+r) line ratios show almost no density dependence. • The La-to-He f-i-r ratios for Mg and Si predicts “characteristic” temperatures of 6.3 x 10⁶ K and 7.3 x 10⁶ K, respectively. • Hot star X-ray sources are not expected to be isothermal. More detailed analyses may provide additional constraints on temperature distributions.
Photospheric Radiation from O Stars Can Dramatically Affect Forbidden-to-Intercombination Line Ratios Calculated He-like f/i line ratios: T = 6.3 x 10⁶ K Incident flux at boundary = W(r) Bn(T*) Magnesium Observed For z Pup, UV photoexcitation (2 3S1 2 3P0,1,2) is the primary depopulation mechanism for the 2 3S1 state. Because of this, the f/i ratio does not provide information on the density. At larger radii, UV flux is lower f/i is larger. The observed Mg f/i ratio is consistent with a plasma emitting at a radius of 3 R*.
For Si, the He-like f/i Ratio Shows Less of a Reduction Due to its Higher Spontaneous Decay Rate to the Ground State The Si Aul value for the 2 3S1 g.s. transition is ~ 5 times higher than that for Mg. Silicon Observed Calculated He-like f/i line ratios: T = 6.3 x 10⁶ K Incident flux at boundary = W(r) Bn(T*) • The observed Si f/i ratio is consistent with a plasma emitting at a radius of ~ 1.3 to 1.4 R*. • Caveats: • Since the photospheric UV flux below 912 Å is lower (relative to a blackbody), the inferred radius should be somewhat lower. • The contribution of Li-like satellites becomes more important for higher-Z elements.
Li-like Satellites to the Hea Line Can Potentially “Contaminate” Forbidden and Intercombination Lines at Low Plasma Temperatures 3S1 9.230 Å He f 9.32 Å 9.168 Å • Li-like satellites form from dielectronic recombination: • 1s21s2s2p 1s22s • 1s21s2p2 1s22p • These satellite lines have wavelengths similar to the He f-i-r lines. 9.294 Å 9.297 Å 9.315 Å 9.319 Å 9.218 Å 9.222 Å 9.283 Å 9.285 Å 9.234 Å 9.235 Å Schematic Energy Level Diagram Showing Li-like Satellites and He-like r-i-f Lines
Calculated Ratios of Li-Like Satellite Line Intensities to He Forbidden Magnesium Plot at left shows the ratio of Li-like satellite intensities to He forbidden line intensity. [Only Li-like satellites with wavelengths near He(f) are included in the ratio.] Li-like satellites become more important at relatively low temperatures. • At the “characteristic” temperatures observed for z Pup, the Li-like satellite line intensities are relatively low. • However, models with non-isothermal plasmas are needed to determine whether these satellites contribute to the observed spectrum.
Simulated Spectrum for Mg is in Good Agreement with Observed z Pup Spectrum • We compute spectra using the temperature deduced from observed La-to-Hea line ratio, and the radius from f/i ratio. • Lines are modeled using Doppler profiles with enhanced widths. • Simulated spectrum for Mg is in good agreement with observed spectrum. • F-I-R spectra are sensitive to UV flux (i.e., radius), but not to density for this parameter space.
Comparison of Simulated Spectra for Si K-Shell Spectral Region • Computed spectra use the temperature deduced from observed La-to-Hea line ratio, and the radius from f/i ratio. • Lines are modeled using Doppler profiles with enhanced widths. Simulated spectra have somewhat less emission in “i” and “f” spectral regions compared to observation. Contamination from Li-like satellites a possibility (?).
Summary • Chandra METG/HETG spectra for z Pup provide important new data for discerning the properties of its X-ray source. • X-ray emission lines show pronounced Doppler broadening. This is consistent with the X-ray source being embedded in the wind. • H-like to He-like line ratios for Mg and Si indicate plasma temperatures are ~ 6 - 7 x 10⁶ K. • Photospheric UV radiation is responsible to depopulating the upper level of the He-like Mg and Si forbidden lines (1s2s 3S1). Initial simulations suggest the observed F/I ratios are consistent with the X-ray-emitting plasma being embedded in the wind at a radius of r ~ 1.5 R* (Si) to r ~ 3 R* (Mg). • Ongoing work will focus on: • detailed analysis of K-shell spectra from other elements • analyzing data from other stars (d Ori and t Sco) • developing more comprehensive modeling of full X-ray spectrum with spatially-distributed X-ray sources.