Download
1 / 17
170 likes | 285 Vues
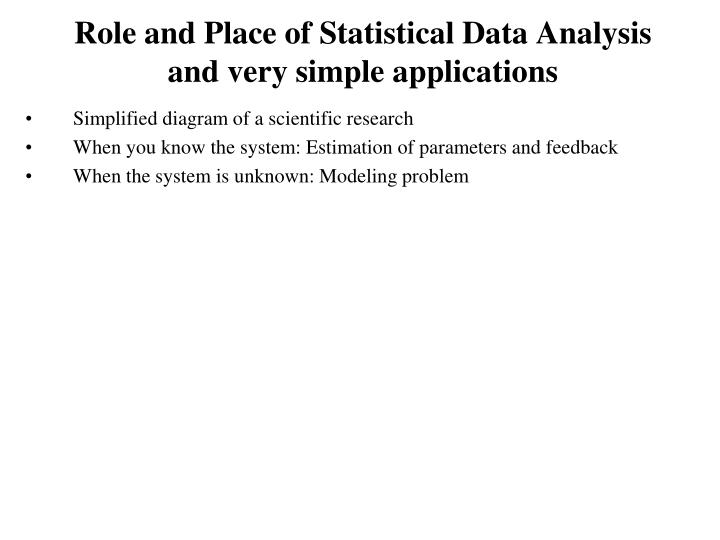
Role and Place of Statistical Data Analysis and very simple applications. Simplified diagram of a scientific research When you know the system: Estimation of parameters and feedback When the system is unknown: Modeling problem. A simple diagram of scientific research: When you know the system.

E N D
Role and Place of Statistical Data Analysisand very simple applications • Simplified diagram of a scientific research • When you know the system: Estimation of parameters and feedback • When the system is unknown: Modeling problem
A simple diagram of scientific research: When you know the system Knowledge New system Model Experiment Estimate Verify Predict Data analysis
Simple application of statistics • Using previously accumulated knowledge you want to study a system • Build a model of the system that is based on the previous knowledge • Set up an experiment and collect data • Estimate the parameters of the model and change the model if needed • Verify if parameters are correct and they describe the current model • Predict the behaviour of the experiment and set up a new experiment. If prediction gives good results then you have done a good job. If not then you need to reconsider your model and do everything again • Once you have done and satisfied then your data as well as model become part of the world knowledge Data Analysis is used at the stage of estimation and verification
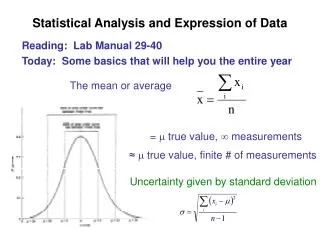
Simple application of statistics The result of the model is usually a function dependent on two types of variables. The first type is that can be varied (x) and the second type you want to estimate (): Where x is a variable you may be able to control and is a variable you want to estimate. As a result of experiment you get observations for y at each point - x. Then using one of the techniques (e.g. Maximum likelihood, Bayesian statistics) you carry out the estimation. Prediction is carried out for values of x that you have not done experiment for. Real life problems are more complicated. In many cases controllable parameters and observations are dictated by the nature of experiment. But model is something different that is dependent on the parameters you estimate using this experiment I.e. experiment gives: But you want (you still need parameters):
Simple application of statistics You have a model and the results of experiment. Then you carry out estimation of parameters (e.g. using simplest least-squares technique): This simple estimation uses assumptions: 1) Errors in experiment are independent, 2) Errors have 0 mean and 3) errors have exactly same variance. After carrying out estimation of the parameters the next stage is to find out how accurate are they. Once this stage is complete, you carry out prediction (can you predict a value of y at the point x where you have not done experiment). If prediction at this stage works then model is fine.
Simple application of statistics: Example Hellung dataset from ISwR package: An experiment is on growth of cells. Here we use only part of the experiment. From theory it is known that cell diameter depends on cell concentration by power law: D=aCb, where C – cell concentration and D is average cell diameter. First we plot to see if we can observe theoretical model behavior. Now problem is to find the parameters of the system (a and b) Diameter vs concentration log(Diameter) vs log(concentration)
Simple application of statistics: Example There are 32 observations: For each concentration there is an average diameter. We need to fit log(a)+b log(C) into log(D). It can be done using lm command (we will learn theory behind this command later). As a result of this fit we get b=-0.0532 and log(a)=3.7563 (a=42.79). Same plot in the original scale log(Diameter) vs log(concentration) and theoretical line
When system is too complicated Sometimes the system you are trying to study is too complicated to build a model for. For example in psychology, biology the system is very complicated and there are no unifying model. Nonetheless you would like to understand the system or its parts. Then you use observations and build some sort of model and then check it against the (new) data. Schematic diagram: Data (Design) Model Estimate Verify Data analysis is used in all stages Predict
When the system is unknown When you do not know any theoretical model then usually you start from the simplest models: linear models. If linear model does not fit then start complicating it. By linearity we mean linear on parameters. This way of modeling could be good if you do not know anything and you want to build a model to understand the system. In later lecture we will learn some of the modeling tools.
When the system is unknown In many cases just simple linear model may not be sufficient. You need to analyse the data before you can build any sort of model. In these cases you want to find some sort of structure in the data. Even if you can find a structure in the data then it is very good idea to look at the subject where these data came from and try to make sense of it. Exploratory data analysis techniques might be useful in trying to find a model. Graphical tools such as boxplot, scatter plot, histograms, probability plots, plots of residual after fitting a model into the data etc may give some idea and help to get some sort of sensible model. We will learn some of the techniques that can give some idea about the structure of the data.
When the system is unknown When the system is unknown, instead of building the model that can answer to your all question you sometimes want to know answer to simple questions. E.g. if effect of two or more factors are significantly different. For example you may want to compare the effects of two different drugs or effects of two different treatments. We will have a lecture about ANOVA and how to analyse the results using R. ANOVA is useful when you want to compare the effects of more than two factors.
When system is unknown: Example Cricket chrip vs temperature. Description (data taken from the website): http://mathbits.com/Mathbits/TISection/Statistics2/linearREAL.htm “Pierce (1949) measured the frequency (the number of wing vibrations per second) of chirps made by a ground cricket, at various ground temperatures. Since crickets are ectotherms (cold-blooded), the rate of their physiological processes and their overall metabolism are influenced by temperature. Consequently, there is reason to believe that temperature would have a profound effect on aspects of their behavior, such as chirp frequency.” Consider two plots chrips vs temperature (left) and log(chrips) vs temperature (right). Both they show more or less linear behaviour. In this cases simplest of models (linear on temperature) that fits should be preferred.
When system is unknown: Various criteria • Occam’s razor: “entities should not be multiplied beyond necessity” or “All things being equal, the simplest solution tends to be the right one” A potential problem: There might be conflict between simplicity and accuracy. You can build tree of models that would have different degree of simplicity at different levels • Rashomon: Multiple choices of models When simplifying a model you may come up up with different simplifications that have similar prediction errors. In these cases, techniques like bagging (bootstrap aggregation) may be helpful
Some application of data analysis Simplest application of statistics is: You have a vector of observations and you want to know if the mean is equal to some pre-specified value (say zero). Then you calculate mean value and check against this value. It is done by simple t-test. t.test(data) This command will calculate for you the mean, variance of the data and then calculate the relevant statistics. It will also give you confidence intervals. If the confidence interval does not contain the value you want to test against (say zero) then you can say that according to these data with 95% confidence that mean is not equal to zero. More over if p value is very small then you can say with 100-p*100 percent confidence that the value is different from zero
Some application of data analysis: Example Another very simple application of statistics is comparing means of two samples using t.test. Before doing this test it is a good idea to have a look a box plot and test if variances are equal var.test(data1,data2) If it can be assumed that variances are equal then you can use t.test(data1,data2,var.equal=1) If variances are not equal then use t.test(data1,data2,var.equal=1)
Some application of data analysis If you can influence the experiment then you should emphasise the importance of paired designs. If design is paired then many systematic differences due to some unknown factors may be avoided. It is done easily using t.test again t.test(data1,data2,paired=1)
Further reading http://math.u-bourgogne.fr/monge/bibliotheque/ebooks/csa/htmlbook/csahtml.html http://www.itl.nist.gov/div898/handbook/index.htm