Download
1 / 22
220 likes | 367 Vues
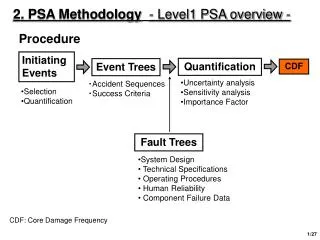
ANS PSA 2008 Topical Meeting - Challenges to PSA during the nuclear renaissance , Knoxville, Tennessee, September 6–11, 2008. Implementation of a Concept for a Risk-informed Diagnosis/Prognosis of Plant States through the RISARD System. Kwang-Il Ahn kiahn@kaeri.re.kr

E N D
ANS PSA 2008 Topical Meeting - Challenges to PSA during the nuclear renaissance, Knoxville, Tennessee, September 6–11, 2008 Implementation of a Concept for a Risk-informed Diagnosis/Prognosis of Plant States through the RISARD System Kwang-Il Ahn kiahn@kaeri.re.kr Integrated Safety Assessment Korea Atomic Energy Research Institute
⊙ Outline • Motivation & Objectives • The Concept of RI-SAM • Computerized Tool SARD • Demonstrative Application • Concluding Remarks
⊙ Motivation Key Ways for a Successful Implementation of SAM • Develop a proper SAM strategy by answering the questions: • How to reduce uncertainties in implementing the established SAM strategies? especially when available resources are limited. • Which essential safety function was lost at the time of the accident? That is, the root cause of the accident;Which safety systems are currently available for SAM? • What will be important future events? and what will be their evolution? • What are potential ‘success paths’ for SAM? • Utilize the computer-based methods & tools for supporting SAM: capable of ① diagnosing the functional states of plant safety systems and ② predicting the future trends of key plant parameters as possible as quickly: • The diagnostic capability for plant states at the time of the accident is required to reduce the uncertainties in the current plant system state and to have a good basis for estimating future plant states. • Based on the current damage states of the plant, the prognostic capability for the possible evolution of the accident gives time enough to take an action for mitigating the consequence of the accident.
Our Approach for supporting SAM: Utilize a PSA-based and SA phenomenological trends-based database (DB)(e.g., plant-, code-, accident sequence-specific SA analysis results) => SAR DB Systematic use of SAM-related information Quick & fast retrieval of the SAM-related information (Quick view) Provide a computerized platform for a comprehensive use of SAR DB in a simple, fast and risk-informing way => RI-SARD Proper information about the plant damage statesat the time of the accident: the root cause of the accident (Diagnosis) Insights on the possible evolution of the accident (critical parameters), based on the current damage states of the plant (Prognosis) Develop the best strategy for supporting SAM(especially when available plant information is limited)=> RI-SAM Helpful in finding success paths for intended SAM actions Helpful in providing appropriate actions to mitigate the accident ⊙ Objectives: RI-SAM Strategy & Tool
⊙ RI-SAM: Diagnosis & Prognosis of Plant States Monitor Plant Data & Signal: Identify the IE & CD states Determine the status/availability of systems needed to mitigate the IE ReSet Plant symptoms & accident time AS screening (iteration loop)(2) Yes Signal Validation Process Prioritize Frequency-based potential accident sequences Determine Plant symptoms More Symptoms ? Quick view Future trend of symptom parameters Diagnosis Symptom-based SARD module Plant symptoms Plant Conditions No Auto switch to module for Prognosis of Future Plant Status Performance 1. Key plant safety parameters for SAM 2. Performance of key SSCs Plant damage states Determine Relevant PDS (1) Decision for Implementation of the relevant SAM strategies Prognosis Scenario-based SARD module Success Paths Countermeasures (dynamic loop)(2) Modification Link to SA Simulator for Interactive Action Note(1): A prescribed accident sequences by which uncertainty can be reduced in taking an action for SAM. Note(2): A process by which the prediction can be updated based upon successive data from plant.
SAR Information - Level 1/2 PSA - Accident Analysis - SAM Information - The other SAR Inform Formatted SAR Data Sets SARD System Operation Data Set Spec. for SARD - Plant/Code/User ID - Accident Sequence Inform(1) - Sensitivity Information (Plant systems & Model parameters) - Severe Accident Code Analysis Results(2) (Code Responses) - Summary of Key Accident Progression Events (Code Result) - Accident Mitigation Options - Data Set & Databank Index - Commentary Parts Data Allocation into SARDB Data Search & Retrieval, Graphical Display - Scenario-based Plant Responses & Behavior - Plant symptom-based Potential Accident Sequences - Status of Plant System & Containment Systems SARDB: Databank (MS Access DB) Database Update & Modification Accident Sequence Types - PSA code-specific plant damage event trees for graphical use - User-specified events sequence SAR-informed Decision-making ⊙ SARD: Data Sets Operation (1)Severe Accident Initiators:LOCA (Large, Medium, Small), Loss of Off-site Power (LOOP), Station Blackout (SBO), Loss of Feed Water (LOFW), Interfacing System LOCA, Steam Generate Tube Rupture (SGTR), Anticipated Transient w/o Scram (ATWS), Loss of AC Bus (125V, 4.16KV), Large Secondary Side Break, General Transient (2)Number of Categorized MAAP Response Parameters (Total 883):RCS/SG/ESF Information (134); Behavior of Core and Fuel (152); Lower Plenum Debris Behavior (77); Lower Head Failure Information (85); Containment Information (196); Source Term Information (229); Hydrogen Generation (10)
⊙ SARD: SARDB Generation (1) Identify the initiating event & the status and availability of systems and equipment needed to avoid or mitigate the severe accident Plant-specific PDS ET PDS sequence: plant damage state + frequency SA phenomenological trends with time Developing trends of key events during accident SARDB Typical Form of SARDB Allocation of Plant-, Code-specific SA Analysis Results into SARDB
Key Role of the PDS ET-based Diagnosis & Prognosis Provide the status of plant and cont. systems at the time of core damage All potential ASs for an IE can be shown at a glance with its graphical form Occurrence probability (or frequency) be systematically derived from PSA The graphical form of PDS ET can be very useful in specifying a particular AS during the data loading and information retrieval process Probability can be utilized as a criterion for screening the risk-significant ASs ⊙ SARD: SARDB Generation (2) Risk-informed SA Analysis
LLOCA PDS ET ⊙ SARD: SARDB Generation (3) Dominant accident initiators: Frequency-based screening of PDS sequences
SAMPLE: Key Events Summary for LF115 (MAAP) Time Events Code Functional Status 0.000 157:T MAIN FW OFF 0.000 224:T MOTOR-DRIVEN AUX FEED WATER FORCED OFF 0.000 232:T CHARGING PUMPS FORCED OFF 17.836 31:T PZR SPRAYS ON 37.431 13:T REACTOR SCRAM 37.431 156:T MSIV CLOSED 42.578 153:T SEC SV(S) FIRST OPEN BROKEN S/G 42.578 163:T SEC SV(S) FIRST OPEN UNBROKEN S/G'S 867.556 161:T UNBKN S/G DRY 870.375 151:T BROKEN S/G DRY 1109.376 3:TH VALVE FIRST OPENED 1109.376 4:TH VALVE FIRST OPENED 1109.376 5:TH VALVE FIRST OPENED 1113.182 35:T VOID FRACTION IN PZR < 0.1 1728.464 4:T MAIN COOLANT PUMPS OFF 2584.444 691:T TRUE: CORE HAS UNCOVERED 4888.784 509:T TRUE: MAX. CORE TEMP EXCEEDS 2200. F 5084.019 690:T TRUE: MAXIMUM CORE TEMPERATURE HAS EXCEEDED 2499 K 5188.688 508:T TRUE: MAX. CORE EXIT TEMP EXCEEDS 1200. F 5962.269 2:T RELOCATION OF CORE MATERIALS TO LOWER HEAD STARTED 5987.935 103:T UPPER COMPT. SPRAYS ON 6778.318 3:T RV FAILED 6794.329 5:T HPI ON 6794.329 6:T LPI ON 6857.934 188:T ACCUMULATOR WATER DEPLETED 8142.179 1003:T TRUE: 1 TH COMPT BURNING IN PROGRESS 8142.179 1048:T TRUE: 4 TH COMPT BURNING IN PROGRESS 8142.179 1063:T TRUE: 5 TH COMPT BURNING IN PROGRESS 8142.492 1033:T TRUE: 3 TH COMPT BURNING IN PROGRESS 9897.961 5:F HPI OFF 9897.961 181:T RECIRC SYSTEM IN OPERATION …. ⊙ SARD: SARDB Generation (5) Events history: Plant system status with time PDS sequence- specific SA code analysis Parameters history: SA code parameter behavior with time
Specification of Code Data (Multiple) Specification of Databank Index Specification of Code Data (Single) Specification of the Target Scenario SAR Data ASQ data Plant Data Specification of Sensitivity Information Check of the Allocated Information SA Code data Code results AMP & Summary Data SARDB MS Access DB ⊙ SARD: SARDB Generation Module
⊙ SARD: Two-way information Retrieval Set target Plant ID & Code ID Scenario Base (1) Symptom Base (2) PSA Information: IE & Target Sequence Plant Symptoms: - Code Parameters - Time windows More symptoms? AS Screening Data Search: Plant-/Code-/AS sequence-specific Responses Prioritize Accident Scenarios (i = 1, n), in a risk-informing way Auto Switch Display - Plant states - Base response - Sensitivity case - SAMG parameters - SSC performance - Events History Target Sequence End of Search (1) Retrieval of the specified- accident sequence-based plant/code behavior (Accident Diagnosis) (2) Retrieval of plant symptoms-based potential accident sequences (Accident Prognosis)
PDS ET Events Functional Status Set Plant & Code information The most probable The most probable plant system state plant system state List of potential List of potential Switch to the Scenario-based Module plant damage plant damage Switch to the Scenario-based Module states states Progression Progression Future trend of Future trend of of key events of key events plant parameters plant parameters User User - - specified specified plant symptoms plant symptoms ⊙ SARD:Plant Symptom-based Diagnosis
Display of the Corresponding PDS ET PDS ET Events Functional Status Set Plant & Code information User User - - specified specified accident conditions accident conditions User User - - specified specified code/plant code/plant parameters parameters Future history key events Future history key events & & plant parameters plant parameters ⊙ SARD: PDS sequence-based Prognosis
⊙ Demo Application: Diagnosis of PDS sequences Target: OPR1000-/MAAP-specific SARDB for 6 Initiating Events (Large/Medium/Small LOCAs, LOOP, SBO, SGTR)
⊙ Demo Application: Prognosis of Future Trend Future Trends of ‘TWCR’ for the Predicted 11 PDS Sequences Diagnostic result: future trend of ‘TWCR’ for ‘SBLOCA_S012’ After Screening SBLOCA_S012:SLOCA*/RT*/HPI*/AFW*/SR1*HPR*/DPR*LPR*CSR TWCR: temperature of water in core (K) SBLOCA_S012: TWCR
SAMG Entry Time ! ⊙ SAM-Decision Flow Chart (DFC)-SAMG entry time Making predictions about future trend of the 7 plant safety parameters to trigger the relevant SAMG and their entry times, based on the user-specified thresholds LBLOCA-S03 S/G Water Level Entry time: 6.85 sec. Entry time:10.4 sec. RCS Pressure Entry time: 30.32 sec. Containment Pressure
⊙ SAM-SSC Performance-failure time & probability Making predictions about when core damage, core support plate failure, induced RCS & SG creep failure, reactor vessel failure, and containment failure will occur SBLOCA-S26 Water level in RPV Core uncover at 19876 sec. RCS HL: unbroken RCS HL: broken No induced creep failure S/G: unbroken S/G: broken RPV LH Creep at 37355 sec. PRV LH creep P-tube ejection P-tube heatup Debris jet impingement
⊙ Concluding Remarks • Summary • Based on a concept of a RI-SAM, the present RI-SARD system explores • a symptom-based diagnosis of potential PDS sequences in a risk-informing way & • a plant damage sequence-based prognosis of key plant parameter behavior, in a simple, fast, and efficient way. • The replicated use of both processes makes it possible to extract information required for taking the intended SAM actions,consequently leading to an answer about what is the best strategy for SAM. • An example application through the OPR1000- and MAAP code-specific SAR DB has shown that the present approach can • enhance a diagnostic capability for anticipated plant states, • give the SAM practitioners more time to take actions for mitigating the accident, • reduce the still relatively large uncertainty in the field of SAM, and • consequently, help guide the TSC staffs through a severe accident.
⊙ Concluding Remarks • Future Plan for Improvement • Will involve the ability to link decisions made by RISARD with the SAM procedure and SA simulator, so that the impact of the SAM actions on an accident progression can be feedback to in an interactive way to a user. • Will involve the use of a more structured approach capable of ①diagnosing the current plant system state, ② predicting the most probable accident pathway during the progress of an accident, and ③ taking the best strategy to terminate its progression into an undesirable consequence, including a linking with • a diagnostic logic tree to diagnose effectively potential plant damage states, • a simplified APET capable of predicting the progress of accidents accurately, and • a more sophisticated logical rule capable of extracting appropriate SAM strategies for a given plant damage state • In addition, we will explore increasing the number of accident types recognized by RI-SARD (e.g., various spectrum of break sizes for LOCA & SGTR)