Download
1 / 77
770 likes | 850 Vues
In this presentation, we will: Describe each step the Compass model and show comparable steps in the IRM. Compass = What, , Where, How IRM= Who , What, When, Where, How, Why Take a household through these steps and show how the household is treated differently in the two models.

E N D
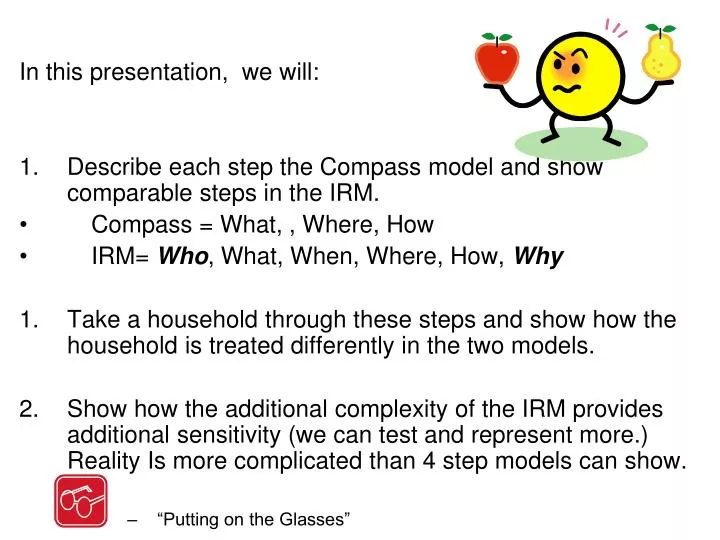
In this presentation, we will: • Describe each step the Compass model and show comparable steps in the IRM. • Compass = What, , Where, How • IRM= Who, What, When, Where, How, Why • Take a household through these steps and show how the household is treated differently in the two models. • Show how the additional complexity of the IRM provides additional sensitivity (we can test and represent more.) Reality Is more complicated than 4 step models can show. • “Putting on the Glasses”
The New Regional Model - Focus Big Picture • Effects of development pattern/design • UGB scenarios • TOD • Urban Centers • “New” Urbanism vs traditional 20th century suburban patterns • Mixed versus single use
The New Regional Model - Focus Big Picture • Explicit modeling of bike/ped. • Time of day modeling • Person/household characteristics: • Age • Gender • Household population composition • Presence and age of children • Number of workers
The New Regional Model - Focus Big Picture • Number of vehicles • Work at home • Full induced demand for the first time • Trip/tour suppression/re-structuring • Trip-length changes • Mode changes • Time of day changes • Path changes
The New Regional Model - Focus Details for Tekkies • Modeling trips in tours, not separately • Each household and job is given a precise location (xy point) • Each household/person in the region is represented individually – PUMS-level data
The New Regional Model - Focus Details for Tekkies • More / real trip purposes: • Old model: home-based work, home-based non-work, non-home-based • New model: work, school, escort, shopping, eat meal, social-recreation, personal business
The New Regional Model - Focus Bottom Line • The model operates at the level at which decision actually are made • Usually the person • Occasionally the household
The New Regional Model - Focus Bottom Line • The model operates at the level at which decision actually are made • Usually the person • Occasionally the household
The New Regional Model - Focus Bottom Line • disaggregate modeling means recognizing that things are different, and describing them as they are: • Person/household type • Tour/trip type • Location • Time of day
The New Regional Model - Focus Bottom Line • better modeling now – better ability to improve in the future – better ability to run scenarios • Example – where will the elderly live? • Example – use of hybrid / electric vehicles.
Compass i. Network Processing ii. Area Type 1. Trip Generation i. Highway/Transit Skims 2. Trip Distribution 3. Mode Choice i. Parking Cost ii. Time-of-Day 4. Highway/Transit Assignment
IRM 1. Population Synthesizer Network Skims Aggregate Mode/Destination Choice Logsum Generator Mode Choice Logsum Generator 2. Regular Workplace Location Choice 3. Regular School Location Choice 4. Auto Availability Intermediate Stop Logsum Generator 5. Daily Activity Pattern Choice Exact Number of Tours Choice Work Tour Destination Type Choice Model Work-Based Subtour Generation Choice 6. Tour Primary Destination Choice 7. Tour Main Mode Choice 8. Tour Time of Day Choice Intermediate Stop Generation Choice Intermediate Stop Location Choice 9. Trip Mode Choice 10. Trip Departure Time Choice 11. Assignment
How does the model do its job? It answers these questions: • What kind of people… • In what kinds of households… • Living in what locations... • Working and going to school where and how • Do what kinds of things during their day… • Requiring them to make what kinds of trips… • To what locations… • By what travel modes… • By what paths through the transportation system? • At what times?
How does the model do its job? It answers these questions: • What kind of people… • In what kinds of households… • Living in what locations… • Working and going to school where and how • Do what kinds of things during their day… • Requiring them to make what kinds of trips… • To what locations… • By what travel modes… • By what paths through the transportation system? • At what times?
? ? ? What do we know about the people in the households in the Compass model? Answer: nothing. Example Family: Adult - Age? Job status? Adult – Age? Job status? Child – Age? Student status? Relationship To adults?
What do we know about the people in the households in the IRM? Answer: Anything included in the Census. Example Family: Mother, Age 33 Part Time Service Worker Father, Age 34 Full Time Education Worker Son, Age 4 Pre-School Student Family Income : $61,000
How does the model do its job? It answers these questions: • What kind of people… • In what kinds of households… • Living in what locations... • Working and going to school where and how • Do what kinds of things during their day… • Requiring them to make what kinds of trips… • To what locations… • By what travel modes… • By what paths through the transportation system?
How does the model do its job? It answers these questions: • What kind of people… • In what kinds of households… • Living in what locations... • Working and going to school where and how • Do what kinds of things during their day… • Requiring them to make what kinds of trips… • To what locations… • By what travel modes… • By what paths through the transportation system? • At what times?
Ok, so what do we know about household locations in Compass? Answer: They are located in traffic analysis zones, and…
We know a lot more about households in the IRM: why is that better? • Households with more drivers and workers own more cars. • Households with more cars make different choices than households with fewer cars: • They make more tours • And use drive mode for them more often • Point-level location means we actually know: • Walk distance to/from transit • Walk trip distance • Bike trip distance • Short auto trip distance.
We know a lot more about people in the IRM:why is that better? • Lots of reasons! • People tend to work in places where there are a lot of jobs in their field. • Kids tend to go to school where their older siblings go. • Workers tend to go to work, students tend to go to school, retired people tend not to do either (etc.) • People with kids tend to cart them around a lot, and drive doing it.
How does the model do its job? It answers these questions: • What kind of people… • In what kinds of households… • Living in what locations... • Working and going to school where and how • Do what kinds of things during their day… • Requiring them to make what kinds of trips… • To what locations… • By what travel modes… • By what paths through the transportation system? • At what times
What do we know about where jobs are in Compass? Answer: they are in traffic analysis zones, and…
We know a lot more in the IRM:why is that better? • Tie the kind of job people have to the kind of company and its location. • We know precisely how far the company is from the transit stop. • Non-university students tend to go school in their home school district. • We know precisely how far the school is from each home.
How does the model do its job? It answers these questions: • What kind of people… • In what kinds of households… • Living in what locations... • Working and going to school where and how • Do what kinds of things during their day… • Requiring them to make what kinds of trips… • To what locations… • By what travel modes… • By what paths through the transportation system? • At what times?
What do we know about what people do during their day in Compass? • Number of work trips by households in the zone. • Number of other kinds of trips made by households in the zone.
CompassTrip Rates Note also: only three types of trips- Home-Based Work, Home-Based Non-Work, and Non-Home Based
What do we know in the IRM? • Mostly about things they do when they leave the house: • Exception: we know if they work at home. • Out-of-home activities: work, school, shop, eat meal, socialize, escort others, personal business.
Tours Generated in the IRM PARK AND RIDE DAY CARE HOME • TOUR-BASED MODEL • 1 home-based work tour • 1 work- based meal tour • 2 intermediate serve passenger stops • TRIP-BASED MODEL • 4 non-home based trips • Two home-based other trips • NHB trip poorly handled... Walk WORK RESTAURANT
Tours Generated in the IRM HOME WORK STORE • TOUR-BASED MODEL • 1 home-based work tour • 1 shopping stop • TRIP-BASED MODEL • 1 home-based work trip • 1 non-home-based trip • 1 home-based non work trip
Tours Generated in the IRM passenger HOME DAY CARE • TRIP-BASED MODEL • 2 home-based non work trips • TOUR-BASED MODEL • 1 school tour TOTAL TOURS BY INDIVIDUAL: WOMAN: 1 HOME BASED WORK TOUR 1 WORK-BASED MEAL TOUR 2 SERVE PASSENGER STOPS MAN: 1 HOME BASED WORK TOUR 1 SHOPPING STOP CHILD: 1 HOME-BASED SCHOOL TOUR 13 TOTAL TRIPS BY HOUSEHOLD: 1 HOME-BASED WORK 5 HOME-BASED NON-WORK 7 NON-HOME BASED:
Why is it better that the IRM is more detailed in describing why people travel? • Able to depict how changes in demographics, like a larger older population, can cause different amounts and types of travel. • Able to represent how much accessibility and mixed use density a person’s home zone has to other locations impact the amount of travel they do.
How does the model do its job? It answers these questions: • What kind of people… • In what kinds of households… • Living in what locations... • Working and going to school where and how • Do what kinds of things during their day… • Requiring them to make what kinds of trips… • To what locations… • By what travel modes… • By what paths through the transportation system? • At what times?
To what location do people go to do the activities? In Compass, the trip attractions and productions are used to predict trip origins and destinations. Table 23: Final HBW Trip Attraction Rates by Income Group
In Trip-based models, the gravity model predicts the number of trips from origin to destination based on the number of productions in the origin zone and attractions in the destination zone. Friction Factors are calibrated so that modeled trip length frequency distributions match observed trip length frequency distributions. Tij = trips between TAZ i and TAZ j Pi = productions in TAZ i Aj = attractions in TAZ j Kij = “K-factor” adjustment between TAZ i and TAZ j Fij = “friction factor” between TAZ i and TAZ j i = production TAZ j = attraction TAZ n = total number of TAZs
Compass model output From Trip Distribution: Home-Based Work Trips from Zone 307020