Download
1 / 27
270 likes | 385 Vues
What can emission lines tell us? lecture 3 Grażyna Stasińska. photoionization modelling. available photoionization codes why do a model ? how to prodeed ? some examples abundance derivation by model fitting a combined stellar and nebular study

E N D
photoionization modelling • available photoionization codes • why do a model ? • how to prodeed ? some examples • abundance derivation by model fitting • a combined stellar and nebular study • model-fitting of an aspherical nebula using a 3D photoionization code • comments on the interpretation of data from integral field spectroscopy the importance of atomic data
some available photoionization codes • 1D photoionization • Cloudy by Gary Ferland and associates • http://www.nublado.org/ • computes models for ionized nebulae and photo-dissociation regions (PDR) • largely used and well documented • Mappings by Michael Dopita + Kewley, Evans, Groves, Sutherland, Binette, Allen, Leitherer • http://www.ifa.hawaii.edu/~kewley/Mappings/ • computes models for photoionized nebulae and for planar shocks • Xstar by Tim Kallman • http://heasarc.nasa.gov/lheasoft/xstar/xstar.html • computes models for photoionized regions with special attention to X-rays • pseudo-3D photoionization • Cloudy-3D by Christophe Morisset using Cloudy as a basis • http://132.248.1.102/Cloudy_3D/ • allows quick photoionization modelling of 3D nebulae with visualization tools • (including computation and visualization of line profiles) • full-3D photoionization • Mocassin by Barbara Ercolano • available from be@star.ucl.ac.uksee alsohttp://hea-www.harvard.edu/~bercolano/ • Monte-Carlo photoionization code
Why do a model ? • Define a main objective • check the sensitivity of input parameters on outputs • compute a grid of models for easy interpretation of a certain class of objects • calculate ionization correction factors for a given nebula • obtain the chemical composition of a given nebula • derive characteristics of the ionizing source • check stellar EUV model atmospheres • ...
How to proceed? • Gather all the observational constraints needed for the objective • line intensities in various wavelengths ranges and in different apertures • monochromatic images • information on the ionizing source(s) • Define a strategy • how to explore a parameter space • how to deal with error bars • how to test the validity of a model • Conclusion • was the goal achieved? • what it no satisfactory model was found?
abundance derivation by model fitting • 1) Define the input parameters • The characteristics of the ionizing radiation field • The density distribution of the nebular gas • The chemical composition of the nebular gas • The distance • 2) Use a photoionization code (e.g. CLOUDY) that solves • The system of ionization equations for each species • The energy balance equation • The transfer of the ionizing radiation • 3) Compare model output with observations (corrected for extinction) • The total observed Hb flux • The SHb distribution (and the angular size of the Hb zone) • The visual magnitude of the ionizing source • The line intensities • 4) Go back to 1 and iterate until observations are reproduced
the process of model-fitting the Model Must Match all the Observations
for a good quality model fitting • use as many observational constraints as possible • not only line intensity ratios 2) keep in mind that some constraints are very important • eg: HeII/Hb, [OIII]4363/5007 3) some constraints are not independant • eg if [OIII]5007/Hb is fitted => [OIII]4959/Hb should be fitted as well because [OIII]5007/4959 is fixed by atomic physics • if it is not, this may indicate an observational problem, eg that the strong [OIII]5007 line is saturated • 4) chose a good estimator for your “goodness of fit” • eg avoid using a c2 minimization technique • all the observables should be fitted (within limits defined a priori) • try to visualize the comparison model-result as much as possible
possible conclusions from model fitting case 1 - if all the observations are well fitted within the error bars • this may imply that the model abundances are the true abundances • within error bars not easy to determine • If the constraints are insufficient, • the model abundances may be very different from the true ones case 2 - if some observations cannot be fitted • either the observations are not as good as thought • or the model does not represent the object well i.e. some assumptions are incorrect, eg • the nebular geometry (eg not spherical) • the assumed stellar radiation field • some important process is missing (eg heating by an additional mechanism) in case 2 the chemical composition is not known to the desired accuracy
an example of photoionization modelling without a satisfactory solution Detailed modelling of the most metal-poor galaxy I ZW 18 Stasinska & Schaerer 1999 observational constraints • narrow band imaging • line intensities from optical spectrum • ionizing radiation from pop. synthesis fitting the observed stellar data failure of the models = failure of the paper ? • « We have found that, even taking into account strong deviations from the adopted spectral energy distribution of the ionizing radiation and the effect of additional X-rays, the photoionization models yield too low a [OIII]4363/5007 ratio by about 30%. This discrepancy is significant and poses an interesting problem, which cannot be solved by expected inaccuracies in the atomic data. The missing energy is of the same order of magnitude as the one provided by the stellar photons . • Elemental abundance determinations in I Zw 18 are affected by this problem. »
this example shows that • even using a 1D photoionization code one can reach important conclusions • demonstrating that no solution can be found with a code is actually an achievement
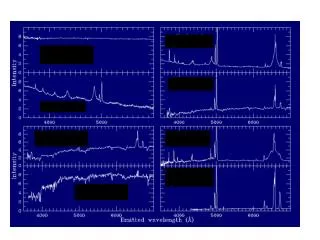
an example of photoionization modelling with insufficient constraints obs Ratag B1 B2 B3 T* 37500K 39000K 37000K 39000K r* (cm) 5.00+10 5.75+10 4.90+10 Rin 0.062 pc 0.050 pc 0.065 pc Rout 0.10 pc 0.087 pc 0.081 pc 0.085 pc F(Hbeta) 3.9-12 3.92-12 3.90-12 3.88-12 ne (cm-3) 2050 1800 1700 1800 He 0.117 0.117 0.180 0.100 C 1.50-3 1.00-3 1.20-3 N 4.80-4 2.50-4 5.50-4 6.00-4 O 2.20-4 2.40-41.00-3 1.20-3 Ne 5.00-5 2.00-4 2.40-4 S 2.30-5 3.00-6 6.00-6 7.00-6 [OII] 3727 0.596 a) 0.587 0.613 0.604 [NeIII] 3869 0.014 0.0084 0.0096 [OIII] 4363 <0.0013 0.0006 0.0002 0.0001 HeII 4686 0.0004 0.0003 0.0003 HI 4861 1.00 1.00 1.00 1.00 [OIII] 5007 0.283 0.304 0.281 0.275 [NI] 5200 0.0149 0.0043 0.0093 0.0087 [NII] 5755 0.0071: 0.0151 0.0069 0.0060 HeI 5876 0.128 0.126 0.124 0.128 [OI] 6300 0.0054 0.0106 0.0116 [NII] 6584 2.85 2.79 2.87 2.81 [SII] 6717 0.0565 0.053 0.0602 0.0558 [SII] 6731 0.084 0.077 0.0868 0.0826 [OII] 7325 0.0091: 0.0126 0.0070 0.0063 T(NII) 6734 5422 5426 T(OIII) 7319 5876 5394 • is the Galactic bulge planetary nebula M 2-5 O-poor or O-rich ? • Ratag 1992 claimed it to be O-poor • Stasinska, Malkov, Golovatyj 1995 found that bothO-poor (B1) and O-rich (B2 and B3) models can fit all the available data • O/H is uncertain by a factor 5 !!!
a combined stellar and nebular study Sergio Simon-Diaz in collaboration with Grazyna Stasinska, Christophe Morisset, Angel Lopez-Sanchez, Jorge Garcia-Rojas, Cesar Esteban the nebula M 43 and its ionizing star
a combined study of the nebula M 43 and its ionizing star objective • determine the physical parameters of the ionizing star (T*, log g) • check whether the stellar energy distribution (SED) above 13.6 eV produced with the model atmosphere code FASTWIND (Puls et al) explains the observed distributions of emission line intensity ratios in the nebula note • the nebula has a rather simple structure for an HII region so the case should be easy • Ferland’s Cloudy is chosen for the photoionization modelling
1) derive the characteristics of the ionizing star T*, log g are obtained by • fitting of the optical stellar spectrum • using the code FASTWIND (Puls et al) L* is then derived using the known distance
2) adapt the energy distribution obtained for the star to use it as an input to Cloudy the absorption edges defined in CLOUDY by default are not the same as in Fastwind • care must be taken while rebinning the spectrum from Fastwind • the meshpoints in Cloudy have been refefined to be very numerous around the absorption edges and so that no “artificial” stellar flux is produced above 13.6 eV
photoionization modelling using Cloudy nebular abundances • taken from Rodriguez1998 estimates using Te-based classical methods nebular density distribution • chosen to reproduce the observed H surface brightness distribution observational constraints • dereddened line intensities from Rodriguez et al 1998 at various positions in the nebula
comparison of the model with the observations The distribution of emission line ratios across the nebula cannot be reproduced by the model possible deductions • the model atmosphere does not predict correctly the SED above 13.6 eV • M 43 is a blister and not a sphere
a blister and its spherical impostor Morisset, Stasinska & Peña 2005, Morrisset & Stasinska 2006 blister geometry H , HeI, [OII] and [OIII] intensity maps H line profile spherical impostor
comparison of the model with the observations The distribution of emission line ratios across the nebula cannot be reproduced by the model possible deductions • the model atmosphere does not predict correctly the SED above 13.6 eV • M 43 is a blister and not a sphere to test these hypothesis • use Cloudy 3D for the photoionization modelling and investigate the blister geometry • perform high resolution observations to observe the line profiles that will uncover the velocity field
Morisset 2006 • How • Cloudy 3D workshttp://132.248.1.102/Cloudy_3D/downloads/Hawai_C3D.pdf
first results for M 43 these models will be compared with data from long slit spectra taken at la Palma in Summer 2006
3D modelling of the PN NGC 7009Gonçalves, Ercolano et al 2005 context many PNe contain knots, which have been argued to be N-enhanced, basing on empirical Te-based methods using classical icfs (N+/N = O+/O) objective present a simple 3D photoionization model, aiming at reproducing the observed geometry and spectroscopic ‘peculiarities’ of a PN like NGC 7009, exploring the possibility that the enhanced [N II] emission observed in the outer knots may be due to ionization effects observational constraints long-slit spectra and HST images
3D modelling of the PN NGC 7009 • the observed (dereddened) line ratios are compared with model results for a slit corresponding to the observed position (ie not with the integrated model values)
3D modelling of the PN NGC 7009 average fractional ionic abundances for the model • I II • N R 5.84 (−3) 0.546 • K 0.136 0.823 • Neb 7.14 (−3) 0.551 • O R 9.72 (−3) 0.862 • K 0.188 0.808 • Neb 1.15 (−2) 0.863 R: N/N+ / O/O+ = 1.66 K: N/N+ / O/O+ = 1.39 Neb: N/N+ / O/O+ = 1.61 ≠ 1 !!! conclusion a realistic density distribution is necessary to derive N/O ratios using classical empirical methods and slit spectroscopy in the case of lines that are emitted in narrow zones
comments on the interpretation of data from integral field spectroscopy • do not start by doing a full 3D photoionization model • too time consuming • probably no satisfying solution will be found • do not use diagnostics that have been designed for integrated nebular spectra • they will lead you to erroneous interpretations let yourself be guided by an understanding of nebular physics and by common sense
the importance of atomic data • Data on first and second row elements (H - Ne) • photoionization cross-sections, • total recombination coefficients, • charge transfer rates, • transition probabilities, • collision strengths • have greatly been improved these last 10 years, mainly thanks to the OPACITY and IRON projects • are generally reliable to within 10-20% • Data on third row elements (S, Ar, …) • collision strengths and transition probabilities should be OK within about 20% • data concerning the ionization structure are incomplete and uncertain (especially dielectronic recombination and charge transfer) • Atomic data bases • http://plasma-gate.weizmann.ac.il/DBfAPP.html data bases for atomic and plasma physics • http://physics.nist.gov/PhysRefData/ physical reference data • http://www.arcetri.astro.it/science/chianti/chianti.html (UV and X rays) • http://www.pa.uky.edu/~peter/atomic/ atomic line list