Download
1 / 26
280 likes | 410 Vues
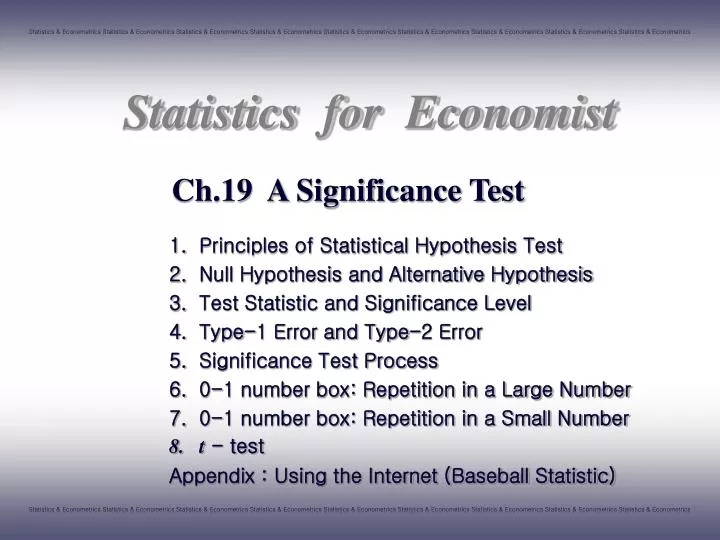
Ch.19 A Significance Test. Principles of Statistical Hypothesis Test Null Hypothesis and Alternative Hypothesis Test Statistic and Significance Level Type-1 Error and Type-2 Error Significance Test Process 0-1 number box: Repetition in a Large Number

E N D
Ch.19 A Significance Test Principles of Statistical Hypothesis Test Null Hypothesis and Alternative Hypothesis Test Statistic and Significance Level Type-1 Error and Type-2 Error Significance Test Process 0-1 number box: Repetition in a Large Number 0-1 number box: Repetition in a Small Number t - test Appendix : Using the Internet (Baseball Statistic)
1 2 3 4 Type-1 Error and Type-2 Error INDEX Principles of Statistical Hypothesis Test Null Hypothesis and Alternative Hypothesis Test Statistic and Significance Level
Principles of Statistical Hypothesis Test Significance Test ? Ex) Tax Revenue under the new taxation ‘Is there no fluctuation on Tax revenue’ Population: 0.1mil. Of Tax payment data Sample: 100 of Random Sample from the Population Difference in Tax payment under new Taxation compared to the old one Sample Average :KRW(-) 0.219mil. Sample S.D.:KRW0.725mil. Does This Difference occur by chance or by real factor?
S.E. of Sample Average • -KRW0.219mil.-KRW0 73,000 Principles of Statistical Hypothesis Test Principles of Significance Test-Reduction to absurdity • 100times Random drawing out from a box of 0.1mil. • Each Number on cards mean the difference of tax At first, Suppose that Average of box is “0” Probability of Occurring (-)KRW0.219 difference by chance is only 1/1,000 = -3
1 2 3 4 Type-1 Error and Type-2 Error INDEX Principles of Statistical Hypothesis Test Null Hypothesis and Alternative Hypothesis Test Statistic and Significance Level
2. Null Hypothesis and Alternative Hypothesis Null and Alternative Hypothesis • Null Hypothesis (H1) Difference occurred by chance Average of Box is “o” • Alternative Hypothesis(H2) Difference is result of real factor Average of Box is a negative Express Hypothesis by ‘notation on Box Model’
1 2 3 4 Type-1 Error and Type-2 Error INDEX Principles of Statistical Hypothesis Test Null Hypothesis and Alternative Hypothesis Test Statistic and Significance Level
Observed – Expect S.E. of Observed Value z or t = Using Sample Standard Deviation 3. Test statistic and Significance Level Test Statistic Test Statistic • Measuring the difference between Observed Value of Data and Expect Value under Null • Popular z-statistic or t-statistic Under the Null
-0.219mil. - 0 73,000 = -3 z-statistic in former Ex. = 3. Test statistic and Significance Level Observed Significance Level : p-value This probability is called ‘Observed Significance Level’ or ‘p-value’ Provability less then -3 in S.E. unit = 1/1000 p-value means probability earning a extreme test statistic above observed statistic. As This probability get less, Base of argument against Null get larger.
Significance Level (Base of decision) 3. Test statistic and Significance Level Reject of Null Hypothesis • Z-test is demonstration by a contradiction Null(H0) p-value is less than certain Reject the Null! • p-value < : Rejecting H0 in a significance level (Statistical significant) • p-value > : Not to Reject H0 in a significance level (Statistical insignificant)
3. Test statistic and Significance Level One-sided Test and Two-sided Test Null(H0) Alternative(H1) Argument of a Alternative has a direction ☞ One-sided Test Not having a direction ☞ Two-sided Test Ex) One-sided Vs One-sided Vs Two-sided Vs
1 2 3 4 Type-1 Error and Type-2 Error INDEX Principles of Statistical Hypothesis Test Null Hypothesis and Alternative Hypothesis Test Statistic and Significance Level
4. Type-1 Error and Type-2 Error Type-1 Error and Type-2 Error Power of Test = 1- Prob.(Type-2 Error) Probability to make proper decision in a case that we should reject the Null (‘This makes you reject when you should’=power)
5 6 7 8 t-test INDEX Significance Test Process 0-1 number box: Repetition in a Large Number 0-1 number box: Repetition in a Small Number Appendix : Using the Internet (Baseball Statistics)
5. Significance Test Process Significance Test Process Design a Box Model and Make a Null hypothesis Calculate a Expect Value given that Null hypothesis is true Define a Test Statistic measuring difference between a Observed and a Expect Calculate a p-value, the observed significance level Comparep-value to significance level
5 6 7 8 t-test INDEX Significance Test Process 0-1 number box: Repetition in a Large Number 0-1 number box: Repetition in a Small Number Appendix : Using the Internet (Baseball Statistics)
6. 0-1 number box: Repetition in a Large Number Example ‘Karl’ is known as a Great Predictor on fluctuation of Stock Price Index • Making him predict directions of Stock index fluctuation during 100 commercial days • He hit 65days during 100 days • Is Hitting Extra 15 days over 50days by his ability or just by chance?
Observed – Expect S.E. of Observed 0 1 S.D. of Box = S.E. of Number = Z 검정 6. 0-1 number box: Repetition in a Large Number Ex. of Z-test H0 : Karl has a special ability 0 and 1, Each has prob.50% It is like drawing cards100 times in replacement randomly It can not be just by chance p-value= =0.14% 3
5 6 7 8 t-test INDEX Significance Test Process 0-1 number box: Repetition in a Large Number 0-1 number box: Repetition in a Small Number Appendix : Using the Internet (Baseball Statistics)
0 1 : Ann still loves Karl value=1% 7. 0-1 number box: Repetition in a Small Number When we have small sample (1) : Z-test Because of small sample, We can not apply Normal Distribution Ex) Date proposal of ‘Karl’ • 1 date per 2 proposal (before) • 1 date per 9 proposal (now) ‘Did Ann change her mind?’ Sum of 9times random replacement sampling from box above
7. 0-1 number box: Repetition in a Small Number When we have small sample (2) : Sign Test When We have small sample, Qualitative data from 0-1 box should be applied to Sign Test • Under the Null hypothesis, Number of having date (X) follows the Binomial Distribution
5 6 7 8 t-test INDEX Significance Test Process 0-1 number box: Repetition in a Large Number 0-1 number box: Repetition in a Small Number Appendix : Using the Internet (Baseball Statistics)
8. t - test Example Ex) Accuracy of Speedometer • Select 5 speedometers in random • Measure a car’s speed running at 100 km/h 108, 113, 98, 102, 118 • Average of Observed data = 107.8 • Standard Deviation of Observed data = 7.22 • S.D of Sample Sum = • S.E of Sample Aver. = H0 : There is no bias in each speedometer
value 8. t - test t - test • p-value when using Normal Distribution Curve < 1% Because We have a small sample, we can’t calculate an accurate Standard Deviation of the box So, Normal Distribution Curve can’t be applied Use t-distribution curve Degree of Freedom = ‘Number of Observation-1’= 5-1= 4 As D.F. get less, Tail get thicker
5 6 7 8 t-test INDEX Significance Test Process 0-1 number box: Repetition in a Large Number 0-1 number box: Repetition in a Small Number Appendix : Using the Internet (Baseball Statistics)
Appendix : Using the Internet(Baseball Statistics) • In general, People think a ‘Homerun Hitter’ as a Big Man with powerful swing. So People think a ‘Homerun Hitter’ has many strike-knock-outs and slow feet. • Do a Empirical Work on that myth. Baseball Statistics – Myth Vs Statistics -