Download
1 / 13
130 likes | 276 Vues
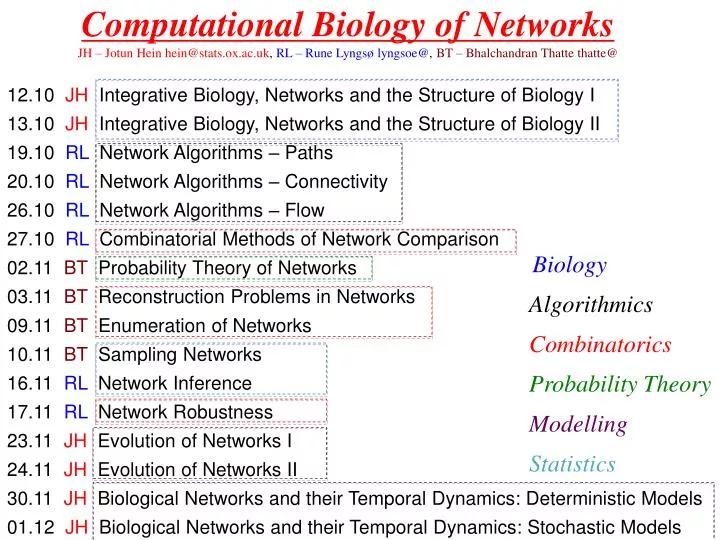
Computational Biology of Networks JH – Jotun Hein hein@stats.ox.ac.uk , RL – Rune Lyngsø lyngsoe@ , BT – Bhalchandran Thatte thatte@. 12.10 JH Integrative Biology, Networks and the Structure of Biology I 13.10 JH Integrative Biology, Networks and the Structure of Biology II

E N D
Computational Biology of Networks JH – Jotun Hein hein@stats.ox.ac.uk, RL – Rune Lyngsø lyngsoe@, BT – Bhalchandran Thatte thatte@ 12.10 JH Integrative Biology, Networks and the Structure of Biology I 13.10 JH Integrative Biology, Networks and the Structure of Biology II 19.10 RL Network Algorithms – Paths 20.10 RL Network Algorithms – Connectivity 26.10 RL Network Algorithms – Flow 27.10 RL Combinatorial Methods of Network Comparison 02.11 BT Probability Theory of Networks 03.11 BT Reconstruction Problems in Networks 09.11 BT Enumeration of Networks 10.11 BT Sampling Networks 16.11 RL Network Inference 17.11 RL Network Robustness 23.11 JH Evolution of Networks I 24.11 JH Evolution of Networks II 30.11 JH Biological Networks and their Temporal Dynamics: Deterministic Models 01.12 JH Biological Networks and their Temporal Dynamics: Stochastic Models Biology Algorithmics Combinatorics Probability Theory Modelling Statistics
Mini project-examination • It is expected to be 3 days worth of work. • You will be given this in week 8 • I would expect 7-10 pages • You will be given 2-4 key references • A set of guiding questions that might help you in your writing • You can chose between a set of topics broadly covering the taught material • "Where a topic is assessed by a mini-project, the mini-project should be designed to take a typical student about three days. You are not permitted to withdraw from being examined on a topic once you have submitted your mini-project to the Examination Schools."
The Cell, the Central Dogma and the Multicellular Organism The Cell – ignoring shape and compartmentalisation (10-5 m): DNA – string over 4 letters/nucleotides {A,C,G,T} Transcribed by base pairing (A-T(U), C-G) into: RNA – string over 4 letters/nucleotides {A,C,G,U} Nucleotides in groups of 3 (codons) translated into amino acids: Protein – string over 20 letters/amino acids Proteins governs (among other things) Metabolism Epigenetics – DNA and chromosome is modified as part of governing regulation. Data: highthroughput-collected without reference to a hypothesis, experiment – data collected relative to hypothesis The Cell creates the individual through ~40 duplications
Structure of Integrative Genomics Classes Protein Metabolite DNA mRNA Phenotype Concepts Parts GF Mapping Systems Biology Physical models: Models: Networks Integrative Genomics Phenomenological models: Hidden Structures/ Processes Unobservered/unobservable Knowledge: Externally Derived Constraints on which Models are acceptable Evolution: Cells in Ontogeny Individuals/Sequences in a Population Species Model Selection Data + Models + Inference Analysis: Functional Explanation
The Central Dogma & Data Protein-DNA binding Data Chip-chip protein arrays Phenotype Protein Metabolite DNA mRNA Embryology Organismal Biology Translation Cellular processes Transcription Genetic Data SNPs – Single Nucleotide Polymorphisms Re-sequencing CNV - Copy Number Variation Microsatellites Transcript Data Micro-array data Gene Expression Exon Splice Junction Proteomic Data NMR Mass Spectrometry 2D-gel electrophoresis Metabonomic Data NMR Mass Spectrometry 2D-Gel electrophoresis Phenotypic Data Clinical Phenotypes Disease Status Quantitative Traits Blood Pressure Body Mass Index Metabonomics Genetical Genomics Proteomics Transcriptomics Genetic Mapping
The key questions for any data type(s) F M P T G Classes Protein Metabolite DNA mRNA Phenotype Parts • What is the state space of a single of observable and its (unobservable) biological state ? • What is the dimension of the observation vector at each level? • What is the distribution of an individual observable • Are there correlation within a level? Statistical? Mechanistic? • Are there correlation between levels? Statistical? Mechanistic? • Are there conditional independencies? Say T and M are conditionally independent given P ? • How does a level evolve between species? How does it vary within a population? • Does it vary between tissues or diseases states?
Networks A Cell A Human • A cell has ~1013 atoms. 1013 • Describing atomic behavior needs ~1015 time steps per second 1028 • A human has ~1013 cells. 1041 105 • Large descriptive networks have 103-105 edges, nodes and labels • What happened to the missing 36 orders of magnitude??? • Which approximations have been made? A Spatial homogeneity 103-107molecules can be represented by concentration ~104 B One molecule (104), one action per second (1015) ~1019 C Little explicit description beyond the cell ~1013 A Compartmentalisation can be added, some models (ie Turing) create spatial heterogeneity B Hopefully valid, but hard to test C Techniques (ie medical imaging) gather beyond cell data
G: Genomes A diploid genome: Key challenge: Making a single molecule observable!! Classical Solution (70s): Many De Novo Sequencing: Halted extensions or degradation extension degradation 80s: From one to many: PCR – Polymerase Chain Reaction 00s: Re-sequencing: Hybridisation to complete genomes Future Solution: One is enough!! Observing the behavior of the polymerase Passing DNA through millipores registering changes in current
G: Assembly and Hybridisation Target genome 3*109 bp (unobservable) Reads 3-400 bp (observable) Contigs Sufficient overlap allows concatenation Contigs and Contig Sizes as function of Genome Size (G), Read Size (L) and overlap (Ø): Lander & Waterman, 1988 Statistical Analysis of Random Clone Fingerprinting {A,C} Complementary or almost complementary strings allow interrogation. probe {T,G}
T - Transcriptomics Classical Expression Experiment: The Gene is transcribed into pre-mRNA Pre-mRNA is processed into mRNA Probes are designed hybridizing to specific positions Measures transcript levels averaging of a set of cells.
T - Transcriptomics RNA-Seq Expression Experiment: Advantages - Discoveries More quantitative in evaluating expression levels More precise in positioning Much more is transcribed than expected. Wang, Gerstein and Snyder (2009) RNA-Seq: a revolutionary tool for Transcriptomics NATURE REVIEwS genetics VOLUME 10.57-64 Transcription of genes very imprecise
P – Proteomics The Size of the Proteome: • 24.000 genes • Alternative Splicing • Post-translational modifications • Phosphorylation of especially serine and threonine • Glycolysation • Ubiquitination Experimental techniques: • 2D electrophoresis • Mass Spectroscopy Analysis Techniques: Segments of proteins have known weights, modifications create known weight changes. Properties of Data: • Noisy • Hard to make dynamic • Quality improving quickly • Qualitative • Average over an ensemble of cells
M – Metabonomics The Size of the Metabolome: • Set of small molecules • Combinatorial techniques allow exhaustive listing – extremely large numbers • Databases exists (eg Beilstein) with all empirically known – millions. • Standard textbook – maximally thousands. Observed tens of thousands Experimental techniques: • Gas chromatography • Mass Spectroscopy • Nuclear Magnetic Resonance (NMR) Analysis Techniques: • Principal Component Analysis • Partial Least Squares, SIMCA • Metabolic Network Analysis Properties of Data: • Noisy • Hard to make dynamic • Quality improving quickly • Qualitative • Average over an ensemble of cells