Download
1 / 29
300 likes | 498 Vues
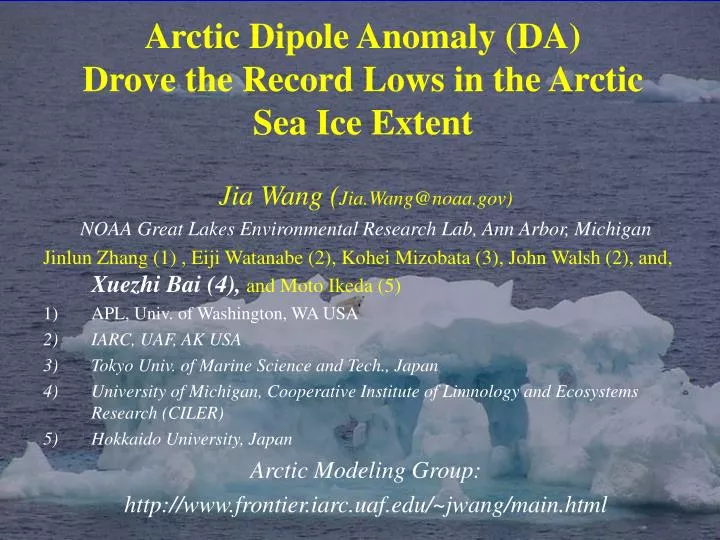
Arctic Dipole Anomaly (DA) Drove the Record Lows in the Arctic Sea Ice Extent. Jia Wang ( Jia.Wang@noaa.gov) NOAA Great Lakes Environmental Research Lab, Ann Arbor, Michigan Jinlun Zhang (1) , Eiji Watanabe (2), Kohei Mizobata (3), John Walsh (2), and, Xuezhi Bai (4), and Moto Ikeda (5)

E N D
Arctic Dipole Anomaly (DA) Drove the Record Lows in the Arctic Sea Ice Extent • Jia Wang (Jia.Wang@noaa.gov) • NOAA Great Lakes Environmental Research Lab, Ann Arbor, Michigan • Jinlun Zhang (1) , Eiji Watanabe (2), Kohei Mizobata (3), John Walsh (2), and, Xuezhi Bai (4), and Moto Ikeda (5) • APL, Univ. of Washington, WA USA • IARC, UAF, AK USA • Tokyo Univ. of Marine Science and Tech., Japan • University of Michigan, Cooperative Institute of Limnology and Ecosystems Research (CILER) • Hokkaido University, Japan • Arctic Modeling Group: • http://www.frontier.iarc.uaf.edu/~jwang/main.html
Outline • Introduction/motivation (brief) • Data and methodology • What is DA, NCEP vs. GCM • DA impacts on sea ice: Regional CIOM • Summer DA2007 summer record low ever ice extent (similar to 2008 summer) • Conclusions
Min ice cover ever on Sep 24, 2007 http://www.ijis.iarc.uaf.edu/cgi-bin/ seaice-monitor.cgi?lang=j 1. Introduction: Sea ice minimums in the western Arctic Ocean off the Coast of Alaska: 2002-2005, and 2007 (record low)!
No correlation between the sea ice export in Fram Strait and AO (Vinje 2001; Hilmer and Jung 1999);Sea ice flux vs. SLP difference across Fram Strait (Kwok and Rothrock 1999);
Questions: 1) Is the AO/NAO the only dominant mode driving the Arctic ice-ocean system? 2) Are both Arctic sea ice circulation and sea ice export (sea ice thinning) only related to the AO (in a sense of cyclonic or anti-cyclonic anomaly)? 3) During neutral/negative AO phase (after year 2000), why sea ice set record lows one after one in the western Arctic, leading to a record minimum in September 2007!?
One regime with max. ice export in coupled climate model History of DA:1) Skeie (2000): BO; 2) Holland (2003); 3) Goose et al. 2003; 4) Semenov and Bengttson (2003)0) Wang et al. (1995)—Internal report of CCGCR of McGill EOF2 of Wang et al. (1995) Unpublished/internal report Ice export regresses to SLP in CCM2, Holland (2003) BO: EOF2, Skeie (2000)
2. Data and Methods • Atmosphere: NCEP/NCAR Reanalysis, 1948-2007 • SIC: Conventional (1901-Sep. 1978; Walsh and Chapman 1990), and SMMR/SSMI (NASA, Oct. 1978-2008; Parkinson 1989), 1x1 degree grid, Arctic Ocean and subpolar regions, 1901-2007 • Sea ice drift: IABP Dataset,1979-2002
Data and Methods (cont.) • EOF analysis • Climatology/anomaly • Composite analysis and T/F-test • Correlation analysis/regression, & Monte Carlo simulation • Case study • Modeling: 1) Japan CCSR/NIES/FRCGC global GCM: 1900-2010 2) Regional Coupled Ice-Ocean Model (CIOM) in the pan Arctic and North Atlantic Ocean (Wang et al. 2002, 2005), and Bering/Beaufort/Chukchi seas (Wang et al. 2008)
What is DA? Second mode of SLP of the Arctic Ocean (from 70-90N) Wu, Wang, Walsh (2006, J. Climate); Watanabe, Wang, Hasumi, Sumi (2006, GRL);Maslanik et al. (2007, GRL) +DA -AO +AO High Low Low -DA TDS
K1 NCEP 59% 63% EOF 1st mode <AO> - Annular structure - In the positive AO phase high : Arctic region low : Mid-latitude Each mode is independent by test of North et al. (1982) K1 19% NCEP 14% EOF 2nd mode <DA> - Dipole structure - In the positive DA phase high : Greenland Sea low : Laptev Sea Regression maps of AO and DA using GCM (K1) and NCEP Regressed winter mean SLP anomalies to each EOF mode (NCEP) [hPa]
GCM’s AO/DA composite anomalies of sea ice thickness and velocity Difference of sea ice thickness (cm) and velocity (cm/s) between the positive and negative phases (AO +) – (AO -) (DA +) – (DA -) Circulation shows cyclonic anomaly. Thickness difference is not significant. Circulation shows meridional anomaly. Thickness difference is significant.
IABP sea ice velocity regressed to EOF1 (AO, upper) and EOF2 (DA, lower)
Fram Strait ice volume transport vs. DA (r=.33) and AO (r=.04) EOF1 (AO) Sea ice volume flux EOF2 (dipole)
5. Summer DA and sea ice minima:1995, 1999, 2002, 2005, 2007, and 2008 (Wang et al. 2009, GRL, in press)
Record lows: 1995, 1999, 2002, 2005, 2007, 2008 (not record low, but 2nd lowest ever!) a) +DA b) b)
62% EOF1 13% EOF2 DA + +AO -AO -DA a) b) DJF DJF EOF1 EOF2 50% 16 % -DA +AO +DA -AO c) d) JJA JJA e) Winter f) Summer
2007: NCEP/NCAR SLP and surface wind anomaly Summer 2007 falls in state: -AO/+DA +DA +DA SLP anomaly was a DA-dominated two-center structure, and the wind anomaly was meridional, blowing from the western to the eastern Arctic This DA-induced wind anomaly was responsible for the 2007 summer minimum +DA +DA
DA predicts record lows: 1995, 2002, 2007, and 2008 (+DA persists from W/S-S); 1999 and 2005 (-DA in W/S, but +DA in summer). So, summer DA is the key! Since 1995, AO was near neutral and negative, while the DA was active. Record low years: 1995, 2002, 2007 and 2008) in first quadrant with +DA persistent from winter-spring to summer. In 1999 and 2005, strong summer +DA contributed to the ice minimum. Scatter plot with summer DA as x-axis and winter-spring DA as y-axis
Heat flux increased along Bering Strait (Mizobata et al., submitted) Heat Flux was calculated using in situ observation and Satellite SST
Heat Flux via Bering Strait in TW 2004 2007 2006 2005 2003 2000 2001 2002 Summer DA Index Relation between Bering strait heat flux and summer DA index Fig. 3b The +DA strengthened inflow of the warm Pacific water since 2000s
b) a) Wind Anomaly in m/s +DA +DA c) SLP and wind anomalies in Aug 2007 (Left) and 2008 (right) Fig. 4
Arctic Sea Ice National Snow and Ice Data Center http://nsidc.org/arcticseaicenews/index.html • 2nd smallest ice pack on record • Large reduction in multi-year ice • Most of ice pack is thin first year ice susceptible to melting
Zhang’s PIOMAS-simulated sea ice motion&advection anomaly Zhang Simulated the sea ice and circulation for 1978-2008 under daily forcing. Courtesy of Jinlun Zhang, APL/UW Ice advection = ice mass convergence: One of every 36 ice velocity vectors plotted.
Zhang’s PIOMAS-simulated sea ice production anomaly in 2007 Min ice cover ever on Sep 24, 2007 http://www.ijis.iarc.uaf.edu/cgi-bin/ seaice-monitor.cgi?lang=j Courtesy of Jinlun Zhang, APL/UW
Comparison between the PIOMAS-simulated and SSM/I-observed ice extends for the period 1978-2008 Simulated compares well against the obs. The correlation is 0.93 in Sep. and 0.92 in Jan-Sep mean. The model reproduces summer ice minima in 1995, 2002, 2005, 2007 and 2008 as well, not for 1999
6. Conclusions • DA is the second dominant mode in the central Arctic (local). Its dynamic impact is more important than the AO, while the local thermodynamic effect is also important, reflecting the feedback of the local ice anomaly to the atmosphere (Wu et al. 2006; Watanabe et al. 2006) • DA-related wind anomaly is meridional: +DAWind anomaly blows from Pacific Arctic to Atlantic Arctic, enhancing TDS, sucking more Pacific Water inflow, driving away and melting more sea ice in Pacific Arctic (Woodgate et al. 2005; Shimada et al. 2006) -DAWind anomaly blows from Atlantic Arctic to Pacific Arctic, weakening TDS, blocking Pacific Water inflow, detaining more ice in the Pacific Arctic
Conclusions (cont.) • Summer sea ice minima in the 2000s, in particular 2007 summer (Zhang), was due to +DA (Wu et al., Watanabe et al. 2006; Wang et al. 2009), while AO was in its negative phase (Overland and Wang 2005; Maslanik et al. 2007)! • DA has two impacts on sea ice of Pacific Arctic: -- Direct (short-term, seasonal): driving sea ice and enhancing TDS, +SAT/SST, local ice/ocean albedo feedback (Wang et al. 2005) -- Indirect (long-term, interannual): sucking in more warm Pacific Water inflow, +SAT/SST, melting more sea ice, enhancing local ice/ocean albedo feedback
Thank you! • Acknowledgements: Supports from • NOAA • NSF