Download
1 / 43
430 likes | 440 Vues
Color Marking Transpiration Design Lab. Red Blue Green Yellow Purple Orange Pink Brown Black. Color Marking Transpiration Design Lab. Colormark your google doc using the highlighter function… choose the lighter shade please.

E N D
Color Marking Transpiration Design Lab Red Blue Green Yellow Purple Orange Pink Brown Black
Color Marking Transpiration Design Lab Colormark your google doc using the highlighter function… choose the lighter shade please. Share this document with Ms. Raczek at mraczek@apps4pps.net
Final Steps Colormark your google doc using the highlighter function. Share this document with Ms. Raczek at mraczek@apps4pps.net Make a copy of the google doc and include “Final Draft” in the name. On this new copy, select all and choose “none” in highlighting function. Use this copy to make your revisions. Bring a hard copy of your final draft to class on Friday, March 8th. Submit your final draft to Turnitin.com Class ID: 19049959 Enrollment Key: Kale
Formatting • Typed, single-spaced • 1 inch margins • Clearly titled sections • Parenthetical citations and bibliography • In the proper order
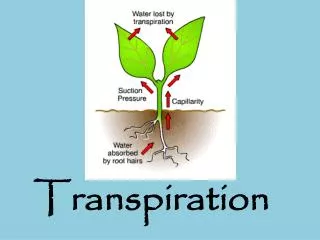
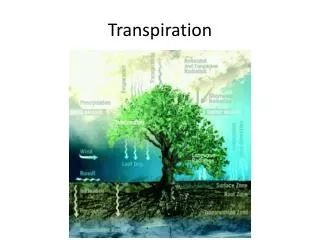
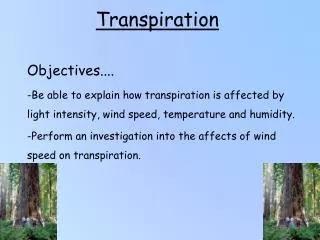
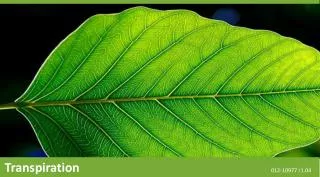
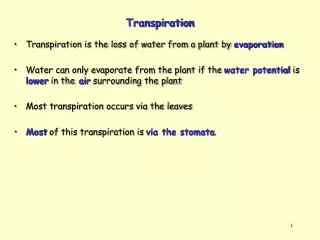
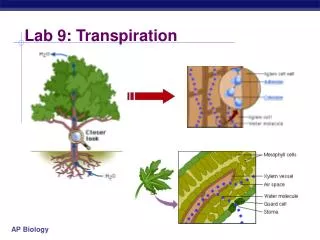
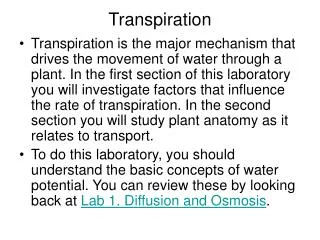
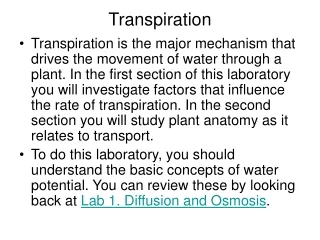
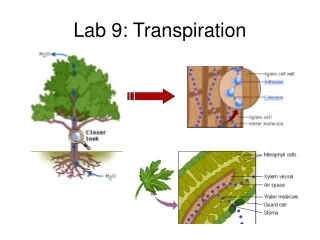
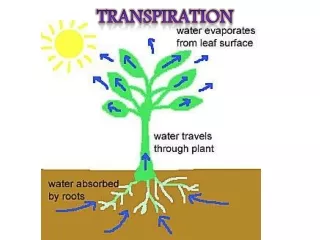
Background Red – discussion of transpiration (including “xylem” and “stomata”)
Background Red – discussion of transpiration (including “xylem” and “stomata”) Blue - discussion of your manipulated variable – what does science say?
Background Red – discussion of transpiration (including “xylem” and “stomata”) Blue - discussion of your manipulated variable – what does science say? Purple – discussion of responding variable – how will you measure transpiration
Background Red – discussion of transpiration (including “xylem” and “stomata”) Blue - discussion of your manipulated variable – what does science say? Purple – discussion of responding variable – how will you measure transpiration Green – personal significance, interest or curiosity
Focused Question What is the effect of (your manipulated variable) on the transpiration rate as measured by a change in (your responding variable) over 48 hours? Green - circle question mark
Focused Question What is the effect of (your manipulated variable) on the transpiration rate as measured by a change in (your responding variable) over 48 hours? Green - circle question mark Blue - manipulated variable
Focused Question What is the effect of (your manipulated variable) on the transpiration rate as measured by a change in (your responding variable) over 48 hours? Green - circle question mark Blue - manipulated variable Red - responding variables
Variables Red - manipulated variable in list
Variables Red - manipulated variable in list Blue – responding variable in list
Variables Red - manipulated variable in list Blue – responding variable in list Green – temperature
Variables Red - manipulated variable in list Blue – responding variable in list Green – temperature Yellow – type of plant (Japanese skimmia)
Variables Red - manipulated variable in list Blue – responding variable in list Green – temperature Yellow – type of plant (Japanese skimmia) Purple – humidity
Variables Red - manipulated variable in list Blue – responding variable in list Green – temperature Yellow – type of plant (Japanese skimmia) Purple – humidity Orange – test tube size
Variables Red - manipulated variable in list Blue – responding variable in list Green – temperature Yellow – type of plant (Japanese skimmia) Purple – humidity Orange – test tube size Pink – surface area of leaf* Brown – amount of light* Black – amount of wind* *could be your MV!
Materials List Red - item(s) used to measure responding variable Blue – test tube (including size)
Procedure Blue - directions for cutting leaves off shrub
Procedure Blue - directions for cutting leaves off shrub Green - directions for setting up test tubes with water and leaves and control
Procedure Blue - directions for cutting leaves off shrub Green - directions for setting up test tubes with water and leaves and control Yellow – directions for measuring and recording initial water measurements in controlled way
Procedure Blue - directions for cutting leaves off shrub Green - directions for setting up test tubes with water and leaves and control Yellow – directions for measuring and recording initial water measurements in controlled way Purple – directions placing test tube racks in room
Procedure Blue - directions for cutting leaves off shrub Green - directions for setting up test tubes with water and leaves and control Yellow – directions for measuring and recording initial water measurements in controlled way Purple – directions placing test tube racks in room Red - directions for measuring and recording the final water measurements
Procedure Blue - directions for cutting leaves off shrub Green - directions for setting up test tubes with water and leaves and control Yellow – directions for measuring and recording initial water measurements in controlled way Purple – directions placing test tube racks in room Red - directions for measuring and recording the final water measurements Pink – directions for other MV measurements (surface area/amount of light)
Procedure Blue - directions for cutting leaves off shrub Green - directions for setting up test tubes with water and leaves and control Yellow – directions for measuring and recording initial water measurements in controlled way Purple – directions placing test tube racks in room Red - directions for measuring and recording the final water measurements Pink – directions for other MV measurements (surface area/amount of light) Orange - directions for processing your data (find the change in water averages, subtract control change, and graph the averages)
Procedure Blue - directions for cutting leaves off shrub Green - directions for setting up test tubes with water and leaves and control Yellow – directions for measuring and recording initial water measurements in controlled way Purple – directions placing test tube racks in room Red - directions for measuring and recording the final water measurements Pink – directions for other MV measurements (surface area/amount of light) Orange - directions for processing your data (find the change in water averages, subtract control change, and graph the averages) Brown – directions for clean up
Results Data charts: • qualitative observations (color, cracks, etc.) • initial, final, change in, change in minus control, AVERAGES Graph: • line or bar graph for the averages • change in water for each condition minus control
Results Red - title on data charts AND graph
Results Red - title on data charts AND graph Blue - label for each variable in data charts AND graph
Results Red - title on data charts AND graph Blue - label for each variable in data charts AND graph Green - unit for each label in data charts AND graph
Results Red - title on data charts AND graph Blue - label for each variable in data charts AND graph Green - unit for each label in data charts AND graph Purple - sample calculation finding the change in water and an average using 4-step method with units
Results Red - title on data charts AND graph Blue - label for each variable in data charts AND graph Green - unit for each label in data charts AND graph Purple - sample calculation finding the change in water and an average using 4-step method with units Orange - annotation under graph
Results Red - title on data charts AND graph Blue - label for each variable in data charts AND graph Green - unit for each label in data charts AND graph Purple - sample calculation finding the change in water and an average using 4-step method with units Orange - annotation under graph Yellow – qualitative data
Conclusion Red - restatement of focused question
Conclusion Red - restatement of focused question Blue – answer, describing trends
Conclusion Red - restatement of focused question Blue – answer, describing trends Green - discussion of data as justification for above (report all 3 average changes in water)
Conclusion Red - restatement of focused question Blue - answer, describing trends Green - discussion of data as justification for above (report all 3 average changes in height) Yellow - compare your results with accepted science… did you get the expected results?
Conclusion Red - restatement of focused question Blue - answer, describing trends Green - discussion of data as justification for above (report all 3 averages) Yellow - compare your results with accepted science… did you get the expected results? Orange - use science to explain your results… why do your results make sense? (or not?)
Bibliography Full citations for any outside sources you used to write this lab report
Final Steps Colormark your google doc using the highlighter function. Share this document with Ms. Raczek at mraczek@apps4pps.net Make a copy of the google doc and include “Final Draft” in the name. On this new copy, select all and choose “none” in highlighting function. Use this copy to make your revisions. Submit your final draft to Turnitin.com on Friday, March 8th. Class ID: 19049959 Enrollment Key: Kale