Download

1 / 16
170 likes | 192 Vues
Date: Thursday, 31 January 2019. Hydrographs. Complete the multiple choice quiz on rivers. Learning Objectives: To be able to describe what a hydrograph is To be able to explain how precipitation links to discharge To be able to evaluate how hydrographs differ.

E N D
Date: Thursday, 31 January 2019 Hydrographs Complete the multiple choice quiz on rivers Learning Objectives: To be able to describe what a hydrograph is To be able to explain how precipitation links to discharge To be able to evaluate how hydrographs differ
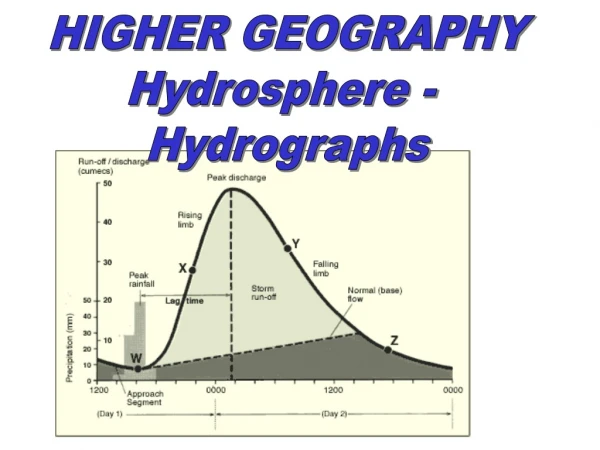
How does precipitation link to discharge? What is discharge? Discharge is the volume of water passing a particular point in a river in a given time. It is measured in cubic metres per second (cumecs). Discharge = Cross section x velocity A river’s discharge can depend on many factors, including the amount, type and intensity of precipitation. A hydrograph shows how a river’s discharge changes in response to a precipitation event.
PEAK RAINFALL=highest rainfall Rainfall shown in mm, as a bar graph 3 2 mm Discharge (m3/s) 4 1 3 2 0 12 24 36 48 60 72 Hours from start of rain storm
PEAK DISCHARGE / FLOW=highest discharge of the river Discharge in m3/s, as a line graph 3 2 mm Discharge (m3/s) 4 1 3 2 0 12 24 36 48 60 72 Hours from start of rain storm
Rising limb The rising flood water in the river 3 Rising limb 2 mm Discharge (m3/s) 4 1 3 2 0 12 24 36 48 60 72 Hours from start of rain storm
Falling limb Peak flow Falling flood water in the river 3 Rising limb Falling limb 2 mm Discharge (m3/s) 4 1 3 2 0 12 24 36 48 60 72 Hours from start of rain storm
Lag time lag time Time difference between the peak of the rain storm and the peak flow of the river Peak flow 3 Rising limb Recession limb 2 mm Discharge (m3/s) 4 1 3 2 0 12 24 36 48 60 72 Hours from start of rain storm
Base flow lag time Peak flow Normal discharge of the river 3 Rising limb Recession limb 2 mm Discharge (m3/s) 4 1 3 2 Base flow 0 12 24 36 48 60 72 Hours from start of rain storm
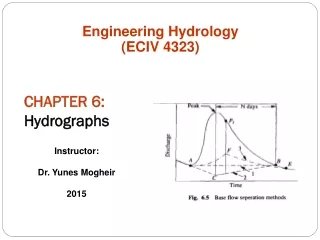
How might hydrographs differ? Brainstorm reasons why these hydrographs look different. Think of human and physical factors that will affect the discharge. Learning Objectives: To be able to describe what a hydrograph is To be able to explain how precipitation links to discharge To be able to evaluate how hydrographs differ
Assess your learning- did you get these factors? • Prolonged rainfall • Impermeable soil/ rock • Steep sided valley • Small river basin • Little vegetation • Urban area • Poor farming practices Read the hand out to find out more Learning Objectives: To be able to describe what a hydrograph is To be able to explain how precipitation links to discharge To be able to evaluate how hydrographs differ
B A Discharge Discharge Time A ‘flashy’ hydrograph has a short lag time and a high peak discharge Other hydrographs have a longer lag time and a lower peak discharge
Extended Writing You are looking to move home. However, you are worried it may be an area that is prone to flooding. You need to do your research. Compose an email to the local council, putting forward your concerns. Include: • How 2 physical factors cause flooding • How 2 human factors cause flooding • Your knowledge on hydrographs and how they can look flashy! Learning Objectives: To be able to describe what a hydrograph is To be able to explain how precipitation links to discharge To be able to evaluate how hydrographs differ
Plenary Quick fire definitions: • Lag time • Rising Limb • Peak discharge • Base flow • Flashy hydrograph • Slow response hydrograph Learning Objectives: To be able to describe what a hydrograph is To be able to explain how precipitation links to discharge To be able to evaluate how hydrographs differ
HomeworkQuestion Explain the factors affecting river discharge. (6 marks) Mark Scheme: L1 (1-2) There is a basic statements of some factors L2 (3-4) develops and links statements together. L3 (5-6) detailed statements, more than one type of factor (human/physical)
How many marks would you give this? Why? WAGOLL Mark Scheme: L1 (1-2) There is a basic statements of some factors L2 (3-4) develops and links statements together. L3 (5-6) detailed statements, more than one type of factor (human/physical) The amount of water will be high if the river is in an area with steep slopes. This will cause the water to run quickly over the surface due to gravity, before it has time to soak in. It will reach the river quickly and the amount of water will increase. The previous weather can also cause changes. If it has been dry, rain will soak into the ground and will be slow to reach the river. However, if it has been wet, the water will flow over the surface reaching the river quickly. How could you improve this answer?


![Hydrographs [Date] Today I will: - Be able to construct and understand flood hydrographs](https://cdn3.slideserve.com/5580541/hydrographs-date-today-i-will-be-able-to-construct-and-understand-flood-hydrographs-dt.jpg)