Download
1 / 36
360 likes | 481 Vues
Measuring the Effect of Waiting Time on Customer Purchases. Andrés Musalem Duke University. Agenda. Background My research Measuring the effect of waiting time on customer purchases. Background:. Santiago, Chile. Ind. Engineering MBA, U. of Chile. Ph.D., Wharton.

E N D
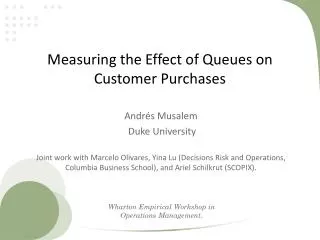
Measuring the Effect of Waiting Time on Customer Purchases Andrés Musalem Duke University
Agenda • Background • My research • Measuring the effect of waiting time on customer purchases
Background: Santiago, Chile Ind. Engineering MBA, U. of Chile Ph.D., Wharton
Teaching Interests: • Market Research (U. Chile) • Pricing (Wharton) • Marketing Management (WEMBA, CCMBA, MEM) • GATE: Global academic travel experience (Daytime MBA) • South America • Product Management (WEMBA, CCMBA) • Marketing Practicum (Daytime MBA):
My research: Quantitative Marketing • Mathematical models to study: • How consumers react to coupon promotions? • Implications for targeting • How consumers react to out of stocks? • Implications for inventory planning • How consumers react to waiting time? • Implications for customer service • How to estimate demand for products not yet introduced in a market? • Implications for assortment/product line decisions • How should firms make efforts to attract or retain customers? • How should firms manage customer expectations? • underpromise and overdeliver? Data driven Game Theory
Measuring the Effect of Waiting Time on Customer Purchases Andrés Musalem Duke University Joint work with Marcelo Olivares, Yina Lu (Decisions Risk and Operations, Columbia Business School), and Ariel Schilkrut (SCOPIX).
Retail Decisions & INFORMATION Assortment Pricing Promotions Customer Experience, Service • Lack of objective data • Surveys: • Subjective measures • Sample selection • Point of Sales Data • Loyalty Card / Customer Panel Data • Competitive Information (IRI, Nielsen) • Cost data (wholesale prices, accounting)
Operations Management Literature • Research usually focuses on managing resources to attain a customer service level • Staff required so that 90% of the customers wait less than 1 minute • Number of cashiers open so that less than 4 customers are waiting in line. • Inventory needed to attain a 95% demand fill rate. • How would you choose an appropriate level of service? • Trade-off: operating costs vs service levels • Link between service levels and customer purchase behavior Research Goal
Real-Time Store Operational Data: Number of Customers in Line • Snapshots every 30 minutes (6 months) • Image recognition to identify: • number of people waiting • number of servers + • Loyalty card data • UPCs purchased • prices paid • Time stamp
Modeling Customer Choice Require waiting (W) No waiting
Modeling Customer Choice Require waiting (W) No waiting Price sensitivity Consumption rate & inventory consumer visit product Waiting cost for products in W Seasonality
Matching Operational Data with Customer Transactions • Issue: do not know what the queue looked like (Q,E) when a customer visited the deli section • Use marketing and operationsmanagement tools to model the evolution of the queue between snapshots (e.g., 4:45 and 5:15): • Choice Models: how likely is a customer to join the line if Q customers are waiting? • Queuing theory: how many customers will remain in the queue by the time a new customer arrives? Queue length Number of employees ts: cashier time stamp ts 4:15 4:45 5:15 5:45 QL2(t), EL2(t) QL(t), EL(t) QF(t), EF(t)
Results: What drives purchases? • Customer behavior is better predicted by queue length (Q) than expected waiting time (W, which is proportional to Q/E)
Question: • Consider two hypothetical scenarios: • What if we double the number of employees behind the counter? • What if the length of the line is reduced from 10 to 5 customers? • Both half the expected waiting time, but which one would have a stronger impact on customer purchase behavior? • What’s the implication?
Managerial Implications: Combine or Split Queues? Pooled system: single queue with c servers Split system: c parallel single server queues, customers join the shortest queue (JSQ)
Managerial Implications: Combine or Split Queues? Pooled system: single queue with c servers Split system: c parallel single server queues, customers join the shortest queue (JSQ)
Managerial Implications: Combine or Split Queues? congestion congestion • Pooled system is more efficient in terms of average waiting time • In split system, individual queues are shorter => If customers react to length of queue, this can help to reduce lost sales (by as much as 30%)
Estimated Parameters • Effect is non-linear • Increase from Q=5 to 10 customers in line • => equivalent to 1.7% price increase • Increase from Q=10 to 15 customers in line • => equivalent to 5.5%price increase • Negative correlation between price & waiting sensitivity • Pre-packaged products don’t help much. • Attract only 7% of deli lost sales when Q=5 -> Q=10
Managerial Implications: Category Pricing • Example: • Two products H andL with different qualities and prices: pH > pL • Customers sensitive to price are insensitive to waiting and vice versa. • What if we offer a discount on the price of the L product?
Congestion & Demand Externalities $$ $$ $$ $$ $$ $$ $ $ $ $ $ $ $ $ $ $ Price Discount on Product L
Managerial Implications: Category Pricing • Example: • Two products H andL with different prices: pH > pL • Customers sensitive to price are insensitive to waiting and vice versa. • What if we offer a discount on the price of the L product? • If price and waiting sensitivity are negatively correlated, a significant fraction of H customers may decide not to purchase Cross-price elasticity of demand: % change in demand of H product after 1% price reduction on L product
Conclusions • New technology enables us to better understand the link between service performance and customer behavior • Estimation challenge:limited information about the queue • Combine choice models with queuing theory • Results & implications: • Consumers act as if they consider queue length, but not speed of service > Consider splitting lines or making speed more salient • Price sensitivity negatively correlated with waiting sensitivity > Price reductions on low priced products may generate negative demand externalities on higher price products
Queues and Traffic: Congestion Effects Queue length and transaction volume are positively correlated due to congestion
Model Estimation Details • Customer arrival rate (¸): store traffic data • Service rate (¹): given ¸ and an initial guess of utility model we estimate ¹ by matching the observed distribution of queue lengths with that implied by the Erlang model. • Queue length: Given ¹ and ¸, and the initial guess of utility model we estimate the queue length that customers faced (integrating the uncertainty about the time when they visited the deli). • The estimated queue lengths is used to estimate the probability of a customer joining the queue. • The process can be repeated until utility converges.
Marketing and other disciplines demand forecast consumer decisions Statistics Psychology Marketing word of mouth Economics Sociology competition Engineering Ethnography in-depth consumer research sales force allocation
Marketing Management Help Vinay & Sameer
How would you promote the Ford Ka? Unilever:Should Unilever introduce a new product in Brazil? Would you improve Starbucks’ service? 3C’sSTP+4P’s Angiomax:What price would you charge? Hulu:Ads vs No Ads? Why Teams Vinay and Sameer’s social media approach was successful? Molson: Why the social media campaign was not successful?
Purchase probability versus queue length and number of employees