Download
1 / 16
160 likes | 350 Vues
Fast Imputation Using Medium- or Low-Coverage Sequence Data. Topics. Cost of chip vs. sequence data Chips : Nonlinear increase with SNP density Sequence : Linear increase with read depth Imputation methods for sequence data Few programs designed for low read depth

E N D
Topics • Cost of chip vs. sequence data • Chips: Nonlinear increase with SNP density • Sequence: Linear increase with read depth • Imputation methods for sequence data • Few programs designed for low read depth • Value of including HD chip in sequence data
Imputation algorithm (findhap v4) • Prior allele probabilities = pop’n frequency • Compute Prob(nA, nB | genotypes, errate) • Test ancestor haplotype likelihoods first • Find most likely 2 haplotypesfrom library • Compute haplotype posteriors from priors • Test long, then medium, then short segments
Computation required • Bulls: 250 sequenced + 250 HD, 1 chromosome • Time (10 processors): findhap 10 min, BeagleV4 3 days • Memory: findhap 5 Gbytes, Beagle <5 Gbytes • Input data: findhap 0.5 Gbytes, Beagle 5 Gbytes • findhap: 2 bytes / SNP [A, B counts stored as hexadecimal] • Beagle: 20 bytes / SNP [Prob(AA), Prob (AB), Prob(BB)] • Output data: findhap 1 byte vs. Beagle 20 bytes / SNP
Accuracy of Findhap vs. Beagle 250 bulls had sequence + HD, 250 others were imputed from HD
Accuracy from HD for bulls * depth Sequences had 1% error, HD imputed using findhap
Accuracy including HD in sequence Correlations of estimated with true genotypes for 500 bulls sequenced with 1% error and 250 bulls with HD only
Imputation from 10K, 60K, 1X, or 2X Reference population is 500 bulls, 8X read depth, 1% error
Sequenced human read depth * error 884 humans sequenced for 394,724 SNPs on chromosome 22
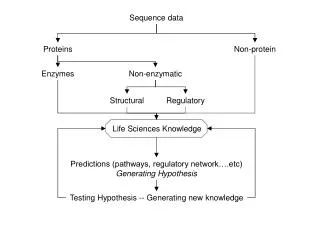
Software at http://aipl.arsusda.gov • Simulate genotypes (programs written 2007) • pedsim.f90, markersim.f90, genosim.f90 • Simulate A and B counts, Poisson plus error • geno2seq.f90 • Impute using haplotype likelihood ratios • findhap.f90 version 4
Conclusions • High read depth is expensive (linear cost) • Low read depth requires additional math • Haplotype probabilities | (A B counts, error) • Imputation improved with findhap version 4 • Up to 400 times faster than Beagle • findhap more accurate for low coverage • Some gain from including HD in sequence
Acknowledgments • Jeff O’Connell and Derek Bickhart provided helpful advice on sequence analysis and software design and testing