Download
1 / 27
280 likes | 461 Vues
Peak Oil. Models to help understand peak oil Dr. Robert J. Brecha University of Dayton. Chautauqua Course, May 22-24, 2006. Some Basics. +Alaska. Lower 48. US Energy Information Agency: http://www.eia.doe.gov/oil_gas/petroleum/pet_frame.html. US. Indonesia. UK. Iran?. Venezuela.

E N D
Peak Oil Models to help understand peak oil Dr. Robert J. Brecha University of Dayton Chautauqua Course, May 22-24, 2006
Some Basics +Alaska Lower 48 US Energy Information Agency: http://www.eia.doe.gov/oil_gas/petroleum/pet_frame.html
US Indonesia UK Iran? Venezuela Many Countries Have Peaked! http://www.bp.com/genericsection.do?categoryId=92&contentId=7005893
OPEC Proved Crude Oil Reserves Energy Information Agency, posted March 2005, January 1, 1980 - January 1, 2005 Estimates
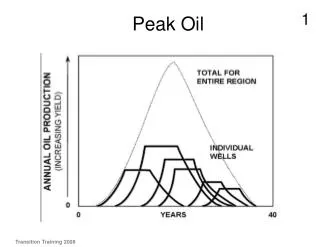
dQ = kQ(1 – Q/Q∞) dt Hubbert’s Logistic Curve “Economic” argument: We will always find more and increase ultimate recovered amount 1980 Prediction
Problem with Logistic Curves At early stages, curves for widely differing total amounts may look very similar. There are too many free fitting parameters
Hubbert Linearization P = kQ(1 – Q/Q∞) Q (Gbbl) http://www.theoildrum.com/story/2006/1/11/6047/13568
HL - Texas http://graphoilogy.blogspot.com/
www.ihs.com US Geological Survey Estimates Bentley, Global Oil and Gas Depletion – an Overview, Energy Policy30 (2002)
Rough Outline of the Future • USGS published reserve estimates in 1998 • EIA uses those estimates, along with consumption patterns to predict future growth • A gap between predicted demand and predicted production appears by 2025 • Gap is to be filled with a) Saudi Arabia producing >20 MMbbl/day, and b) “unidentified unconventional” sources
One Prediction (1998) R.C. Duncan and W. Youngquist,“Encircling the Peak of World Oil Production,” Natural Resources Research 8, 219-233 (1999). Also by the same authors: “The World Petroleum Life-Cycle” http://www.dieoff.com/page133.pdf
Finding Norways R.C. Duncan and W. Youngquist, “The World Petroleum Life-Cycle” http://www.dieoff.com/page133.pdf
2/3 ! Matthew Simmons – “Twilight in the Desert”
Peak Models USGS BP
Keep Watching… http://www.theoildrum.com
Peak “Good” Oil OPEC Monthly Oil Market Report, August 2005